
|
|
FLUCTUATION PLOTName:
For the fluctuation plot, a grid is created so that is each combination of categories has a fixed position on the grid. At each grid position, two rectangles are drawn. The first is drawn in a background color and is full size (i.e., the maximum count). A second rectangle is drawn in a foreground color with a height proportional to the count for that particular combination of categories. The background rectangle is drawn to give a sense of scale. If you do not want this background rectangle, then set the color equal to the background color of the plot. Some analysts find the format of the flucuation plot easier to interpret than the mosaic plot. Although the mosaic and fluctuation plots were developed to visualize counts for categorical data, Dataplot can also generate the fluctuation plot for various statistics. For example, you could use it to display mean values for several factor variables. In particular, we have found it useful for displaying binomial probabilities. For displaying the value of a statistic, the minimum value of the statistic over all combinations of categories will be drawn with zero height and the maximum value of the statistic over all categories will be drawn at the full height. Intermediate values will be scaled between the minimum and maximum values. The list of supported statistics can be obtained by entering
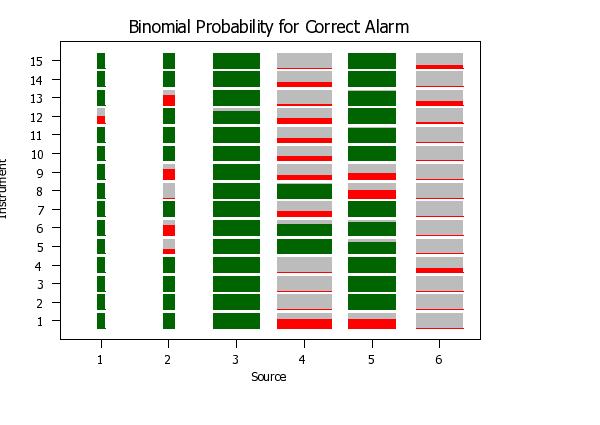
By default, the FLUCTUATION PLOT generates a single foreground color. The CONTOUR option (see syntax 4) allows the foreground color to be set based on the value of the statistic relative to a "levels" variable (this borrows from the TABULATION PLOT. For example, you can specify two colors based on whether the statistic is above or below some threshold value. Alternatively, you can also use the CONTOUR option to provide additional guidance on the value of the statistic.
<SUBSET/EXCEPT/FOR qualification> where <x1> ... <xk> is a list of one to six categorical variables; and where the <SUBSET/EXCEPT/FOR qualification> is optional. This syntax is used for the case where you have raw data (i.e., the data has not yet been cross tabulated) and the statistic of interest is the number of observations in each cell.
<SUBSET/EXCEPT/FOR qualification> where <stat> is the one of the supported statistics: <y1> ... <y3> is a list of one to three response variables (depending on how many variables <stat> requires); <x1> ... <xk> is a list of one to six categorical variables; and where the <SUBSET/EXCEPT/FOR qualification> is optional. This syntax is used for the case where you have raw data (i.e., the data has not yet been cross tabulated) and you are computing a statistic that requires one to three response variables.
where <m> is a matrix containing a two-way table; and where the <SUBSET/EXCEPT/FOR qualification> is optional. This syntax is used for the case where the data have already been cross-tabulated into a two-way table. Although this is typically used for the COUNTS case, the table can in fact contain values for any statistic that has been previously cross-tabulated (including statistics not listed in Syntax 1 - Syntax 3 above).
<SUBSET/EXCEPT/FOR qualification> where <stat> is the one of the supported statistics: <y1> ... <y3> is a list of one to three response variables (depending on how many variables <stat> requires); <x1> ... <xk> is a list of one to six categorical variables; <ylevel> is a variable that defines the levels for the value of the statistic; variables; and where the <SUBSET/EXCEPT/FOR qualification> is optional. This syntax can be used to specify different foreground colors based on the value of the statistic.
FLUCTUATION BINOMIAL PROBABILITY PLOT Y X1 X2 FLUCTUATION PLOT M
When there are two or more categorical variables, the division is first performed vertically, then horizontally. This vertical/horizontal subdivision is repeated until all the categorical variables are accommodated. When there are two or more categorical variables, you can change the vertical/horizontal order to horizontal/vertical by entering the command
To restore the default order, enter
SET FLUCTUATION PLOT CEILING <value> Values less than the floor value will be set to the floor value and values greater than the ceiling value are set to the ceiling value. The default is to use the minimum and maximum values of the computed statistic. For the COUNT case, the floor value will be set to 0. For the BINOMIAL PROBABILITY case, the floor and ceiling values will be set to 0 and 1, respectively. After the fluctuation plot is generated, Dataplot will save the internal parameters STATMINI and STATMAXI that contain the minimum and maximum values, respectively, of the computed statistic.
To reset fixed width bars, enter the command
This option does not apply to the case where the statistic being computed is the frequency counts (COUNT). In this case, the height of the bars already indicates the frequency counts.
BINOMIAL RATIO MEAN MEDIAN DIFFERENCE OF MEANS DIFFERENCE OF BINOMIAL PROPORTIONS added the following command
If this option is set to ON, there are three rectangles that are drawn:
In the default case, we set the color of the rectangles using the following commands (where the colors are set to your taste)
region fill color g75 black region border color g75 black If the uncertainty option is set to on, we set the color of the three rectangles using the following commands (where again the colors are set to your taste)
char bl bl bl bl circle bl char fill on all char hw 0.5 0.375 all region fill color g75 g75 cyan cyan region border color g75 g75 cyan cyan The first 2 colors specify the background color for the rectangles below and above the statistic value, respectively. Colors 3 and 4 specify the foreground colors for the rectangles below and above the statistic value, respectively. Typically we recommend that the same color be used as in the above example. By default, alpha is set to 0.05 for computing the uncertainty intervals. To use a different value of alpha, enter
By default (= OFF), each factor variable is coded from 1 to NDIST with NDIST denoting the number of levels (i.e., distinct values for that factor variable. When there are more than two factor variables and some of the combinations of levels for the factor variables are missing, it is desirable to suppress this coding. Setting this option to ON will use the original units for the factor variables. You may want to code each of the factor variables. For example, if there are four factor variables, you can do something like
LET X2C = CODED X2 LET X3C = CODED X3 LET X4C = CODED X4 SET FLUCTUATION PLOT CODED ON FLUCTUATION BINOMIAL PROBABILITY PLOT Y X1C X2C X3C X4C
SET FLUCTUATION SORTED OFF SET FLUCTUATION SORTED ROW SET FLUCTUATION SORTED COLUMN ON specifies that both the column and row direction will be sorted, OFF (the default) specifies that neither direction will be sorted, ROW specifies that the vertical direction will be sorted, and COLUMN specifies that the horizontal direction will be sorted. You can specify whether the sort is an ascending (the default) or a descending sort by entering the commands
<ASCENDING/DESCENDING> SET FLUCTUATION PLOT ROW SORT DIRECTION ... <ASCENDING/DESCENDING>
SET FLUCTUATION CONTOUR BINOMIAL PROPORTION LOWER SET FLUCTUATION CONTOUR BINOMIAL PROPORTION UPPER
Friendly (2000), "Visualizing Categorical Data", SAS Institute Inc., p. 90.
2009/09: Added uncertainty option for several statistics 2010/07: Added contour option 2017/11: Added uncertainty option for difference of mean statistic 2017/11: Added uncertainty option for difference of binomial proportion statistic
.  Example from page 61 of Friendly
.  Data denotes counts.
read matrix m
 5  29 14 16
15  54 14 10
20  84 17 94
68 119 26 7
end of data
.
label case asis
tic mark label case asis
title case asis
title offset 2
.
x3label
title Fluctuation Plot
y1label Eye Color
x1label Hair Color
tic offset units data
xlimits 1 4
major xtic mark number 4
minor xtic mark number 0
xtic mark offset 1 1
x1tic mark label format alpha
x1tic mark label content Black Brown Red Blond
ylimits 1 4
major ytic mark number 4
minor ytic mark number 0
ytic mark offset 1 1
y1tic mark label format alpha
y1tic mark label content Green Hazel Blue Brown
y1tic mark label justification right
.
line color g75 black
region fill color g75 black
region border color g75 black
.
fluctuation plot m
Program 2:
skip 25
read alarm.dat inst src expalarm obsalarm
let n = size expalarm
let correct = 0 for i = 1 1 n
let correct = 1 subset expalarm = 0 subset obsalarm = 0
let correct = 1 subset expalarm = 1 subset obsalarm = 1
.
label case asis
tic mark label case asis
title case asis
title offset 2
.
x3label
title Fluctuation Plot of Binomial Probability for Correct Alarm
y1label Instrument
x1label Source
tic offset units data
xlimits 1 6
major xtic mark number 6
minor xtic mark number 0
xtic mark offset 1 1
ylimits 1 15
major ytic mark number 15
minor ytic mark number 0
ytic mark offset 1 1
.
line color g75 black
region fill color g75 black
region border color g75 black
.
set fluctuation plot width proportional
fluctuation binomial probability plot correct inst src

Program 3:
skip 25
read ripken.dat y x1 to x4
.
label case asis
tic mark label case asis
title case asis
.
x3label
title Fluctuation Plot for Cal Ripken Mean Batting Average
let string v1 = Low
let string v2 = Middle
let string v3 = Left:sp()High
let string v4 = Low
let string v5 = Middle
let string v6 = Right:sp()High
let igy = group label v1 to v6
let string h1 = Inside
let string h2 = Middlecr()Fastball
let string h3 = Outside
let string h4 = Inside
let string h5 = Middlecr()Curveball
let string h6 = Right
let igx = group label h1 to h6
.
tic offset units data
xlimits 1 6
major xtic mark number 6
minor xtic mark number 0
xtic mark offset 1 1
x1tic mark label format group label
x1tic mark label content igx
ylimits 1 6
major ytic mark number 6
minor ytic mark number 0
ytic mark offset 1 1
y1tic mark label format group label
y1tic mark label content igy
y1tic mark label justification right
.
line color g75 black
region fill color g75 black
region border color g75 black
.
fluctuation mean plot y x2 x1 x4 x3
.
move 50 92
just center
text (Minimun BA: ^statmini, Maximum BA: ^statmaxi)
Program 4:
skip 25
read alarm.dat inst src expalarm obsalarm
let n = size expalarm
let correct = 0 for i = 1 1 n
let correct = 1 subset expalarm = 0 subset obsalarm = 0
let correct = 1 subset expalarm = 1 subset obsalarm = 1
.
label case asis
tic mark label case asis
title case asis
title offset 2
frame corner coordinates 10 20 80 90
.
x3label
title Binomial Probability for Correct Alarm
y1label Instrument
x1label Source
tic offset units data
xlimits 1 6
major xtic mark number 6
minor xtic mark number 0
xtic mark offset 0.6 0.6
ylimits 1 15
major ytic mark number 15
minor ytic mark number 0
ytic mark offset 1 1
y1label displacement 7
.
let p10 = 0.7
let p20 = 1.01
let ylevel = data p10 p20
.
line color g75 red dgreen
region fill color g75 red dgreen
region border color g75 red dgreen
.
set fluctuation plot width proportional
fluctuation binomial probability contour plot correct inst src ylevel
.
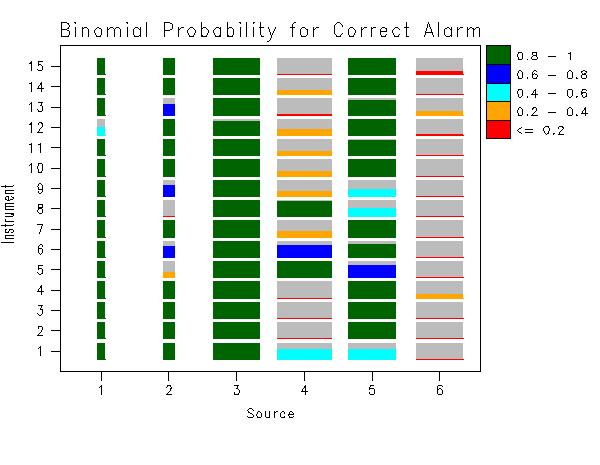
let p1 = 0.20
let p2 = 0.40
let p3 = 0.60
let p4 = 0.80
let p5 = 1.01
let ylevel = data p1 p2 p3 p4 p5
let ncolor = 5
let string color1 = red
let string color2 = orange
let string color3 = cyan
let string color4 = blue
let string color5 = dgreen
region fill on all
region fill color g75 ^color1 ^color2 ^color3 ^color4 ^color5
region border color g75 ^color1 ^color2 ^color3 ^color4 ^color5
line color g75 ^color1 ^color2 ^color3 ^color4 ^color5
.
fluctuation binomial probability contour plot correct inst src ylevel
.
box fill pattern solid
box shadow hw 0 0
justification left
height 1.7
.
let xcoor1 = 81
let xcoor2 = 85
let xcoor3 = xcoor2 + 1
let ycoor1 = 90
let yinc = 4
let ycoor2 = ycoor1 - yinc
.
let kind = ncolor
loop for k = 1 1 ncolor
box fill color ^color^kind
box xcoor1 ycoor1 xcoor2 ycoor2
let ycoor3 = ycoor2 + 1
move xcoor3 ycoor3
let km1 = kind - 1
let aval1 = ^p^km1
let aval2 = ^p^kind
let aval2 = min(1,aval2)
if k < ncolor
if k = 1
text ^aval1 - ^aval2
else
text ^aval1 - ^aval2
end of if
else
text <= ^aval1
end of if
let ycoor1 = ycoor2
let ycoor2 = ycoor1 - yinc
let kind = kind - 1
end of loop
Date created: 01/06/2009 |
Last updated: 12/04/2023 Please email comments on this WWW page to [email protected]. | ||||||||||||||||||||||||||||||||