
|
|
BINARY PLOTName:
The parameters N11, N12, N21, and N22 denote the counts for each category. Success and failure can denote any binary response. Dataplot expects "success" to be coded as "1" and "failure" to be coded as "0". Some typical examples would be:
In these examples, the "ground truth" is typically given as variable 1 while some estimator of the ground truth is given as variable 2. We can define the following quantities from this table:
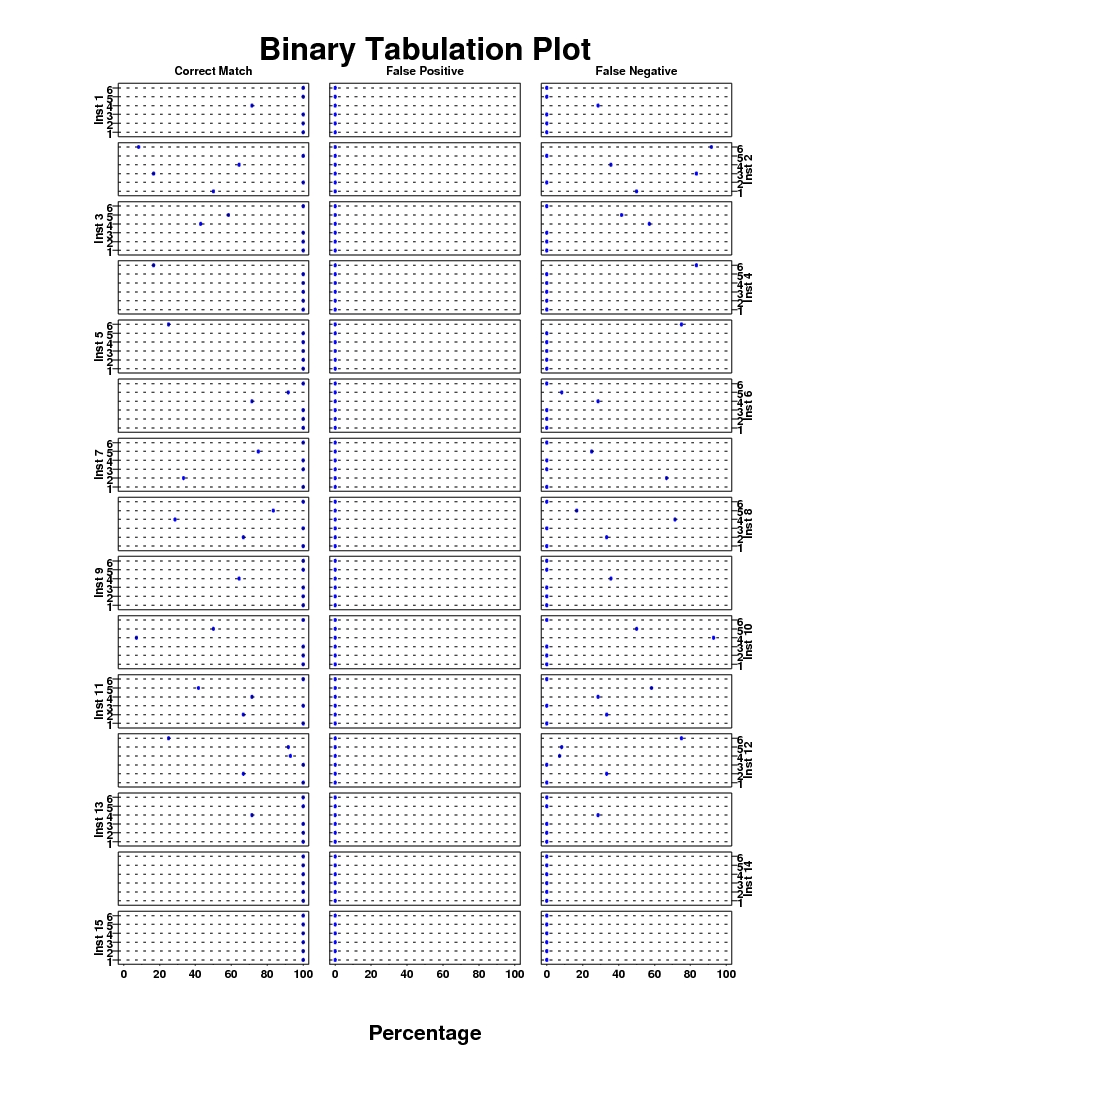
The above table can be generated when there are one or more groups for the data (there will be one table for each group, or each cross-tabulation of groups). The BINARY PLOT command provides a useful way for summarizing the proportions (or percentages) of correct matches, false positives, and false negatives when there are either one or two groups in the data. For the BINARY ... PLOT, the Y coordinate is the group-id variable and the X coordinate is the proportion (or percentage) for one of the statistics described above. This command is most effectively used in combination with the MULTIPLOT command. The columns of the multiplot will specify one of the specific statistics and the rows of the multiplot will specify the values of the second group-id variable (if there is only one group-id variable, there will only be one row in the multiplot). Of course, the role of columns and rows in the multiplot can be reversed. The BINARY TABULATION PLOT is a special form of this command that will automatically create the multiplot. For this form of the command, the columns in the multiplot are:
The first group-id variable specified is used to determine the Y coordinate for the individual plots. The second group-id variable is used to define the rows of the multiplot. If there is only one group-id variable, create a second group-id variable where all rows in the second group-id variable have the same value. It is typically easier to use the BINARY TABULATION PLOT form of this command. However, if you want a different layout for the multiplot (e.g., you might want a 4-column format where true positives and true negatives are used rather than correct matches), then you can use the BINARY ... PLOT form to have more control of the layout.
where <y1> is the first response variable; <y2> is the second response variable; <x> is a group-id variable; <type> is one of the following:
TRUE POSITIVES TRUE NEGATIVES FALSE POSITIVES FALSE NEGATIVES This form will plot percentages (rather than proportions).
where <y1> is the first response variable; <y2> is the second response variable; <x> is a group-id variable; <type> is one of the following:
TRUE POSITIVES TRUE NEGATIVES FALSE POSITIVES FALSE NEGATIVES This form will plot percentages (rather than proportions).
where <y1> is the first response variable; <y2> is the second response variable; <x> is a group-id variable; <type> is one of the following:
TRUE POSITIVES TRUE NEGATIVES FALSE POSITIVES FALSE NEGATIVES This form will plot proportions (rather than percentages).
where <y1> is the first response variable; <y2> is the second response variable; <x1> is the first group-id variable; <x2> is the second group-id variable; and where the <SUBSET/EXCEPT/FOR qualification> is optional. This form generates the multiplot form of the command. It plots percentages (rather than proportions).
BINARY TABULATION PLOT Y1 Y2 X1 X2
SET CONDITION PLOT X AXIS <BOTTOM/TOP/ALTERNATE> SET CONDITION PLOT Y AXIS <LEFT/RIGHT/ALTERNATE> SET CONDITION PLOT FRAME <DEFAULT/CONNECTED/USER> SET CONDITION PLOT LABEL DISPLACEMENT ... <NORMAL/STAGGERED/VALUE> Enter HELP CONDITION PLOT for the details of these commands. You can use the following command to specify the name of a group-id variable that will be used to provide y-axis labels for the plot. These commands are demonstrated in the Program 3 example.
let n = 1
.
let p = 0.2
let y1 = binomial rand numb for i = 1 1 100
let p = 0.1
let y2 = binomial rand numb for i = 1 1 100
.
let p = 0.4
let y1 = binomial rand numb for i = 101 1 200
let p = 0.08
let y2 = binomial rand numb for i = 101 1 200
.
let p = 0.15
let y1 = binomial rand numb for i = 201 1 300
let p = 0.18
let y2 = binomial rand numb for i = 201 1 300
.
let p = 0.6
let y1 = binomial rand numb for i = 301 1 400
let p = 0.45
let y2 = binomial rand numb for i = 301 1 400
.
let p = 0.3
let y1 = binomial rand numb for i = 401 1 500
let p = 0.1
let y2 = binomial rand numb for i = 401 1 500
.
let x = sequence 1 100 1 5
.
label
title case asis
title offset 2
label case asis
tic mark label case asis
tic offset units data
xlimits 0  100
major xtic mark number 6
minor xtic mark number 1
xtic mark offset 5 5
ylimits 1 5
major ytic mark number 5
minor ytic mark number 0
ytic offset 0.5 0.5
y1tic mark label format alpha
y1tic mark label content Groupsp()1 Groupsp()2 Groupsp()3 Groupsp()4 ...
                        Groupsp()5
ygrid on
grid pattern dotted
.
multiplot 1 3
multiplot corner coordinates 10 0 90 95
multiplot scale factor 1 2.5
character circle
character fill on
character color blue
character fill color blue
character hw 2 1.50
line blank
.
x1label Correct Matches
binary correct match plot y1 y2 x
x1label False Positives
binary false positives plot y1 y2 x
x1label False Negatives
binary false negatives plot y1 y2 x
.
end of multiplot
justication center
move 50 97
case asis
text Binary Plot
Program 2:
let n = 1
.
let p = 0.2
let y1 = binomial rand numb for i = 1 1 100
let p = 0.1
let y2 = binomial rand numb for i = 1 1 100
.
let p = 0.4
let y1 = binomial rand numb for i = 101 1 200
let p = 0.08
let y2 = binomial rand numb for i = 101 1 200
.
let p = 0.15
let y1 = binomial rand numb for i = 201 1 300
let p = 0.18
let y2 = binomial rand numb for i = 201 1 300
.
let p = 0.6
let y1 = binomial rand numb for i = 301 1 400
let p = 0.45
let y2 = binomial rand numb for i = 301 1 400
.
let p = 0.3
let y1 = binomial rand numb for i = 401 1 500
let p = 0.1
let y2 = binomial rand numb for i = 401 1 500
.
let x1 = sequence 1 100 1 5
let ntemp = size y1
let x2 = sequence 1 50 1 2 for i = 1 1 ntemp
.
label
title case asis
title offset 2
label case asis
tic mark label case asis
tic offset units data
xlimits 0  100
major xtic mark number 6
minor xtic mark number 1
xtic mark offset 5 5
ylimits 1 5
major ytic mark number 5
minor ytic mark number 0
ytic offset 0.5 0.5
ytic mark label format alpha
ytic mark label content Groupsp()1 Groupsp()2 Groupsp()3 Groupsp()4 ...
                        Groupsp()5
ygrid on
grid pattern dotted
.
multiplot corner coordinates 10 0 90 95
character circle
character fill on
character color blue
character fill color blue
character hw 2 1.50
line blank
.
set condition plot y axis alternate
set condition plot x axis bottom
set condition plot frame connected
frame corner coordinates 5 5 95 95
multiplot corner coordinates 10 10 90 95
binary tabulation plot y1 y2 x1 x2
end of multiplot
.
case asis
justification center
move 50 3
text Percentage
height 3
move 50 97
text Binary Tabulation Plot
Program 3:
orientation portrait
skip 25
read alarm.dat x1 x2 y1 y2
name x1 inst
name x2 src
name y1 exp
name y2 obs
.
let string s1 = Instsp()1
let string s2 = Instsp()2
let string s3 = Instsp()3
let string s4 = Instsp()4
let string s5 = Instsp()5
let string s6 = Instsp()6
let string s7 = Instsp()7
let string s8 = Instsp()8
let string s9 = Instsp()9
let string s10 = Instsp()10
let string s11 = Instsp()11
let string s12 = Instsp()12
let string s13 = Instsp()13
let string s14 = Instsp()14
let string s15 = Instsp()15
let ig = group label s1 to s15
.
character circle
character fill on
character color blue
character hw 0.5 0.375
line blank
xlimits 0 100
major xtic mark number 6
minor xtic mark number 1
xtic offset 3 3
let instdist = distinct inst
let ninst = size instdist
let srcdist = distinct src
let nsrc = size srcdist
ylimits 1 nsrc
major ytic mark number nsrc
minor ytic mark number 0
ytic offset 0.5 0.5
ygrid on
ygrid pattern dotted
.
x3label
label case asis
title case asis
title offset 15
.
set condition plot y axis alternate
set condition plot x axis bottom
set condition plot frame connected
set binary tabulation plot group name ig
frame corner coordinates 5 5 95 95
multiplot corner coordinates 10 10 90 95
multiplot scale factor 10 2.5
binary tabulation plot y1 y2 x2 x1
.
case asis
justification center
move 50 3
text Percentage
height 3
move 50 97
text Binary Tabulation Plot
|
|||||||||||||||||||||||||||||||||||||||||||||||||||||
|
|
|
Date created: 01/07/2008 Last updated: 12/04/2023 Please email comments on this WWW page to [email protected]. |