
|
ASSOCIATION PLOTName:
where
This test statistic can also be formulated as
where
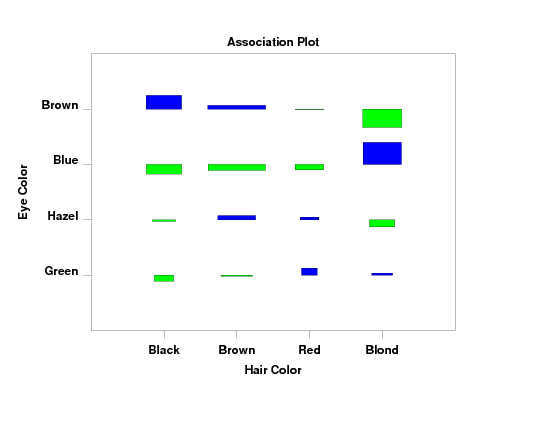
The dij are referred to as the standardized residuals and they show the contribution to the chi-square test statistic of each cell. The association plot is a graphical way of showing these standardized residuals. Specifically, the cells are laid out in a two-way grid and each cell is plotted with a rectangle where
For visual clarity, positive and negative standardized residuals are typically drawn in different colors.
where <y1> is the first response variable; <y2> is the second response variable; and where the <SUBSET/EXCEPT/FOR qualification> is optional. This syntax is used for the case where you have raw data (i.e., the data has not yet been cross tabulated into a two-way table).
where <m> is a matrix containing the two-way table; and where the <SUBSET/EXCEPT/FOR qualification> is optional. This syntax is used for the case where we the data have already been cross-tabulated into a two-way contingency table.
where <n11> is a parameter containing the value for row 1, column 1 of a 2x2 table; <n12> is a parameter containing the value for row 1, column 2 of a 2x2 table; <n21> is a parameter containing the value for row 2, column 1 of a 2x2 table; and <n22> is a parameter containing the value for row 2, column 2 of a 2x2 table. This syntax is used for the special case where you have a 2x2 table. In this case, you can enter the 4 values directly, although you do need to be careful that the parameters are entered in the order expected above.
ASSOCIATION PLOT M ASSOCIATION PLOT N11 N12 N21 N22
Cohen (1980), "On the Graphical Display of the Significant Components in a Two-Way Contingency Table," Communications in Statistics--Theory and Methods, A9:1025-1041.
. Example from page 61 of Friendly
read matrix m
 5  29 14 16
15  54 14 10
20  84 17 94
68 119 26 7
end of data
.
label case asis
tic mark label case asis
title case asis
title offset 2
.
x3label
title Association Plot
y1label displacement 12
y1label Eye Color
x1label Hair Color
tic offset units data
xlimits 1 4
major xtic mark number 4
minor xtic mark number 0
xtic mark offset 1 1
x1tic mark label format alpha
x1tic mark label content Black Brown Red Blond
ylimits 1 4
major ytic mark number 4
minor ytic mark number 0
ytic mark offset 1 1
y1tic mark label format alpha
y1tic mark label content Green Hazel Blue Brown
y1tic mark label justification right
.
line solid
region fill color blue green
.
association plot m

Date created: 07/25/2007 |
Last updated: 12/01/2023 Please email comments on this WWW page to [email protected]. | ||||||||||||||||||||||||||||||||||||||||||||||