
|
|
SLOPPFName:
 . .
with This distribution can be extended with lower and upper bound parameters. If a and b denote the lower and upper bounds, respectively, then the location and scale parameters are:
scale = b - a The general form of the distribution can then be found by using the relation

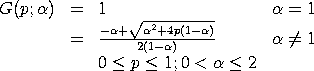
<SUBSET/EXCEPT/FOR qualification> where <p> is a number, parameter, or variable containing values in the interval (0,1); <y> is a variable or a parameter (depending on what <p> is) where the computed slope ppf value is stored; <alpha> is a positive number, parameter, or variable that specifies the shape parameter; <a> is a number, parameter, or variable that specifies the lower limit; <b> is a number, parameter, or variable that specifies the upper limit; and where the <SUBSET/EXCEPT/FOR qualification> is optional. If <a> and <b> are omitted, they default to 0 and 1, respectively.
LET Y = SLOPPF(X,0.5,0,5) PLOT SLOPPF(P,2,0,3) FOR P = 0 0.01 1
LABEL CASE ASIS
TITLE CASE ASIS
TITLE OFFSET 2
.
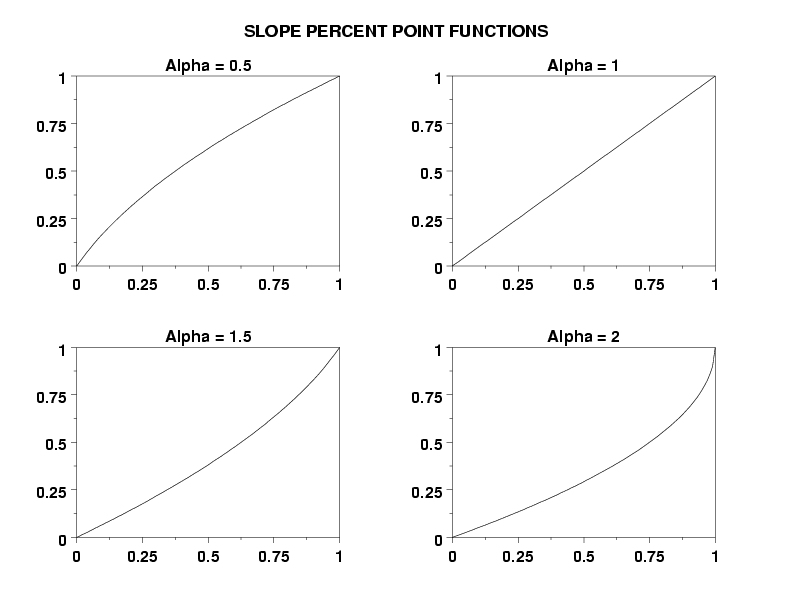
MULTIPLOT 2 2
MULTIPLOT CORNER COORDINATES 0 0 100 95
MULTIPLOT SCALE FACTOR 2
.
LET ALPHA = 0.5
TITLE Alpha = ^alpha
PLOT SLOPPF(P,ALPHA) FOR P = 0 0.01 1
.
LET ALPHA = 1
TITLE Alpha = ^alpha
PLOT SLOPPF(P,ALPHA) FOR P = 0 0.01 1
.
LET ALPHA = 1.5
TITLE Alpha = ^alpha
PLOT SLOPPF(P,ALPHA) FOR P = 0 0.01 1
.
LET ALPHA = 2
TITLE Alpha = ^alpha
PLOT SLOPPF(P,ALPHA) FOR P = 0 0.01 1
.
END OF MULTIPLOT
.
JUSTIFICATION CENTER
MOVE 50 97
TEXT Slope Percent Point Functions
Date created: 11/07/2007 |