|
|
TOPPDFName:
 . .

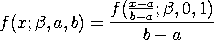
with This distribution can be extended with lower and upper bound parameters. If a and b denote the lower and upper bounds, respectively, then the location and scale parameters are:
scale = b - a The general form of the distribution can then be found by using the relation
Kotz and van Dorp have developed the Topp and Leone distribution as an extension to the triangular distribution. They suggest it as an alternative for cases where a bounded distribution is appropriate (other alternatives include the uniform, triangular, trapezoid, beta, Johnson SB, and two-sided power distributions). The generalized Topp and Leone and reflected generalized Topp and Leone distributions are generalizations of the Topp and Leone distribution.
<SUBSET/EXCEPT/FOR qualification> where <x> is a number, parameter, or variable containing values in the interval (a,b); <y> is a variable or a parameter (depending on what <x> is) where the computed Topp and Leone pdf value is stored; <beta> is a positive number, parameter, or variable that specifies the shape parameter; <a> is a number, parameter, or variable that specifies the lower limit; <b> is a number, parameter, or variable that specifies the upper limit; and where the <SUBSET/EXCEPT/FOR qualification> is optional. If a and b are omitted, they default to 0 and 1, respectively.
LET Y = TOPPDF(X,0.5,0,5) PLOT TOPPDF(X,2,0,3) FOR X = 0 0.01 3
LET A = <value> LET B = <value> LET Y = TOPP AND LEONE RANDOM NUMBERS FOR I = 1 1 N TOPP AND LEONE PROBABILITY PLOT Y TOPP AND LEONE PROBABILITY PLOT Y2 X2 TOPP AND LEONE PROBABILITY PLOT Y3 XLOW XHIGH TOPP LEONE KOLMOGOROV SMIRNOV GOODNESS OF FIT Y TOPP LEONE CHI-SQUARE GOODNESS OF FIT Y2 X2 TOPP LEONE CHI-SQUARE GOODNESS OF FIT Y3 XLOW XHIGH The following commands can be used to estimate the beta shape parameter for the Topp and Leone distribution:
LET BETA2 = <value> TOPP AND LEONE PPCC PLOT Y TOPP AND LEONE PPCC PLOT Y2 X2 TOPP AND LEONE PPCC PLOT Y3 XLOW XHIGH TOPP AND LEONE KS PLOT Y TOPP AND LEONE KS PLOT Y2 X2 TOPP AND LEONE KS PLOT Y3 XLOW XHIGH The default values for BETA1 and BETA2 are 0.1 and 10, respectively. The probability plot can then be used to estimate the lower and upper limits (lower limit = PPA0, upper limit = PPA0 + PPA1). The following options may be useful for these commands.
The maximum likelihood estimate of beta can be computed with the command
The maximum likelihood estimate of beta is;
For the standard Topp and Leone distribution, the maximum
likelihood estimate of
![betahat = n/SUM[i=1 to n][1/LOG{2*X(i) - (X(i))^2}]](eqns/betaml.gif)
If the data lie outside the (0,1) interval, then we first apply the transformation
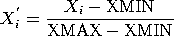
with XMIN and XMAX denoting the minimum and maximum of the
data, respectively. We then estimate
The BOOTSTRAP DISTRIBUTION command can be used to find uncertainty intervals for the ppcc plot, ks plot, and maximum likelihood estimates.
LABEL CASE ASIS
TITLE CASE ASIS
TITLE OFFSET 2
.
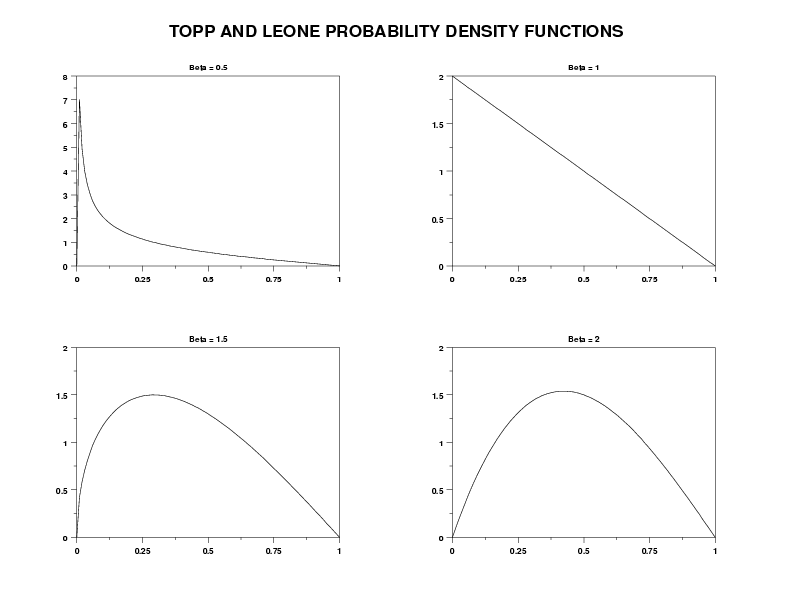
MULTIPLOT 2 2
MULTIPLOT CORNER COORDINATES 0 0 100 95
MULTIPLOT SCALE FACTOR
.
LET BETA = 0.5
TITLE Beta = ^beta
PLOT TOPPDF(X,BETA) FOR X = 0 0.01 1
.
LET BETA = 1
TITLE Beta = ^beta
PLOT TOPPDF(X,BETA) FOR X = 0 0.01 1
.
LET BETA = 1.5
TITLE Beta = ^beta
PLOT TOPPDF(X,BETA) FOR X = 0 0.01 1
.
LET BETA = 2
TITLE Beta = ^beta
PLOT TOPPDF(X,BETA) FOR X = 0 0.01 1
.
END OF MULTIPLOT
.
JUSTIFICATION CENTER
MOVE 50 97
TEXT Topp and Leone Probability Density Functions
Program 2:
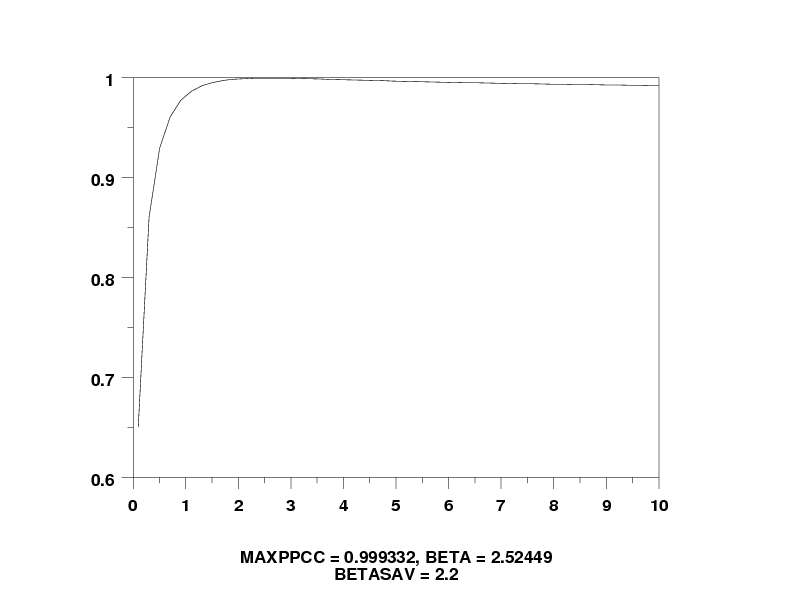
let beta = 2.2
let y = topp and leone rand numb for i = 1 1 200
.
let betasav = beta
topp and leone ppcc plot y
just center
move 50 5
let beta = shape
text maxppcc = ^maxppcc, Beta = ^beta
move 50 2
text Betasav = ^betasav
.
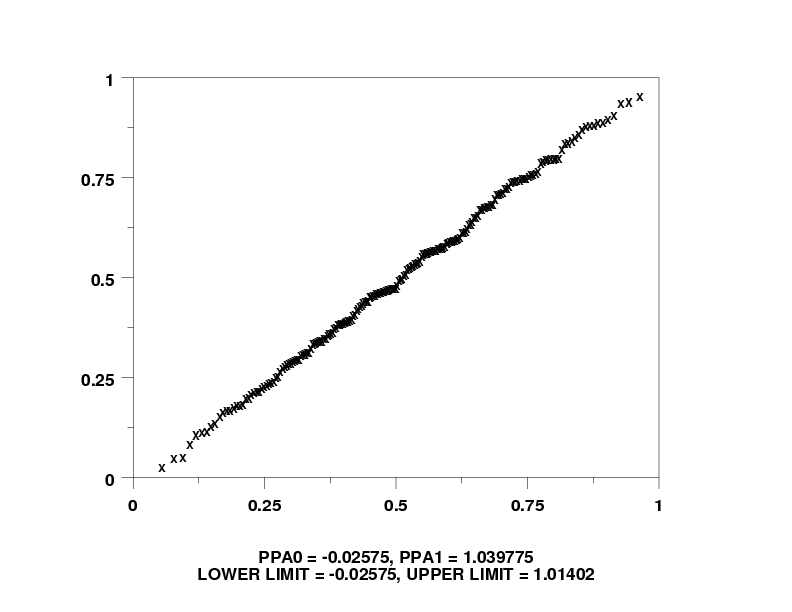
char x
line blank
topp and leone prob plot y
move 50 5
text PPA0 = ^ppa0, PPA1 = ^ppa1
move 50 2
let upplim = ppa0 + ppa1
text Lower Limit = ^ppa0, Upper Limit = ^upplim
char blank
line solid
.
let ksloc = ppa0
let ksscale = upplim
topp and leone kolm smir goodness of fit y
.
topp and leone mle y
Date created: 9/10/2007 |