
|
ODDS RATIO STANDARD ERRORName:
= (N11N22)/ (N12N21) where
N21 = number of failures in sample 1 N12 = number of successes in sample 2 N22 = number of failures in sample 2 The first definition shows the meaning of the odds ratio clearly, although it is more commonly given in the literature with the second definition. Alternatively, the odds ratio can be given in terms of the proportions
= (p11p22)/ (p12p21) where
= proportion of successes in sample 1 p21 = N21/ (N11 + N21) = proportion of failures in sample 1 p12 = N12/ (N12 + N22) = proportion of successes in sample 2 p22 = N22/ (N12 + N22) = proportion of failures in sample 2 Success and failure can denote any binary response. Dataplot expects "success" to be coded as "1" and "failure" to be coded as "0". Dataplot actually returns the bias corrected version of the statistic:
In addition to reducing bias, this statistic also has the advantage that the odds ratio is still defined even when N12 or N21 is zero (the uncorrected statistic will be undefined for these cases). The standard error of this bias corrected odds ratio is then
where o' is the bias corrected odds ratio.
<SUBSET/EXCEPT/FOR qualification> where <y1> is the first response variable; <y2> is the second response variable; <par> is a parameter where the computed odds ratio standard error is stored; and where the <SUBSET/EXCEPT/FOR qualification> is optional.
LET A = ODDS RATIO STANDARD ERROR Y1 Y2 SUBSET TAG > 2
CROSS TABULATE ODDS RATIO STANDARD ERROR Y1 Y2 X1 X2 ODDS RATIO STANDARD ERROR PLOT Y1 Y2 X CROSS TABULATE ODDS RATIO STANDARD ERROR PLOT Y1 Y2 X1 X2 BOOTSTRAP ODDS RATIO STANDARD ERROR PLOT Y1 Y2 JACKNIFE ODDS RATIO STANDARD ERROR PLOT Y1 Y2 Note that the above commands expect the variables to have the same number of observations. If the two samples are in fact of different sizes, there are two ways to address the issue:
let n = 1
.
let p = 0.2
let y1 = binomial rand numb for i = 1 1 100
let p = 0.1
let y2 = binomial rand numb for i = 1 1 100
.
let p = 0.4
let y1 = binomial rand numb for i = 101 1 200
let p = 0.08
let y2 = binomial rand numb for i = 101 1 200
.
let p = 0.15
let y1 = binomial rand numb for i = 201 1 300
let p = 0.18
let y2 = binomial rand numb for i = 201 1 300
.
let p = 0.6
let y1 = binomial rand numb for i = 301 1 400
let p = 0.45
let y2 = binomial rand numb for i = 301 1 400
.
let p = 0.3
let y1 = binomial rand numb for i = 401 1 500
let p = 0.1
let y2 = binomial rand numb for i = 401 1 500
.
let x = sequence 1 100 1 5
.
let a = odds ratio standard error y1 y2 subset x = 1
tabulate odds ratio standard error y1 y2 x
.
label case asis
xlimits 1 5
major xtic mark number 5
minor xtic mark number 0
xtic mark offset 0.5 0.5
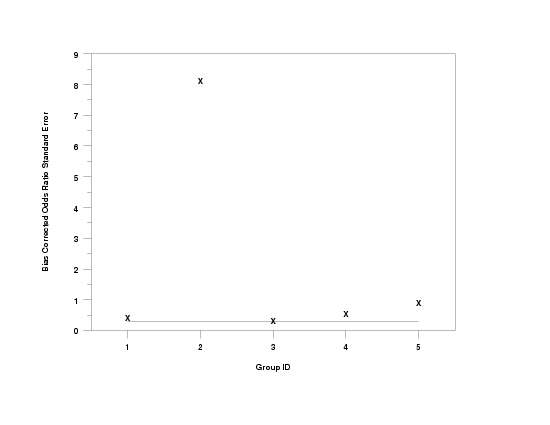
y1label Bias Corrected Odds Ratio Standard Error
x1label Group ID
character x blank
line blank solid
.
odds ratio standard error plot y1 y2 x

|
Privacy
Policy/Security Notice
NIST is an agency of the U.S.
Commerce Department.
Date created: 06/06/2007 | ||||||||||||||||||||||||||||||||||