5.6. Case Studies
5.6.3. Catapult Case Study
5.6.3.3. |
Interaction Effects |
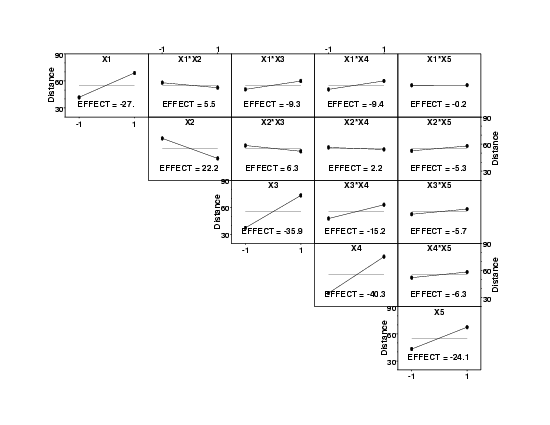
- Ranked List of Factors:
- X4 (arm length) (effect = 40.3 inches)
- X3 (number of bands) (effect = 35.9 inches)
- X1 (band height) (effect = 27.0 inches)
- X5 (start point) (effect = 24.0 inches)
- X2 (stop angle) (effect = -22.2 inches)
- X3*X4 interaction (effect = 15.2 inches)
- X1*X4 interaction (effect = 9.4 inches)
- X1*X3 interaction (effect = 9.3 inches)
- the remaining effects are not listed.
- Interactions: The most important interaction is X3*X4 (number of bands)*(arm length). The estimated interaction is 15.2 units, which is more than 10% of the total spread (8 to 126.5) of the data, and hence is relatively large from a simple numeric point of view. The 15.2 is to be interpreted as follows: the X3 effect changes by 15.2 units depending on whether X4 is -1 or +1. The X3 effect of 35.9 is a single number integrated over all of the data. Since the X3*x4 effect is 15.2, this implies that the X3 effect for X4 = -1 equals 35.9 - 15.2/2 = 28.3 and the X3 effect for X4 = +1 equals 35.9 + 15.2/2 = 43.5.
However, there are a few caveats for using block plots with fractional factorial designs.
- Block plots are not possible in the full set of factors for fractional factorial designs. They are only possible for full factorial designs.
- Full factorials are embedded in any 2k-p design.
- A resolution R, 2k-p design has full factorials (possibly replicated) in any R-1 factors, i.e. R-1 balance.
- We can generate block plots in any subset of R-1 factors.
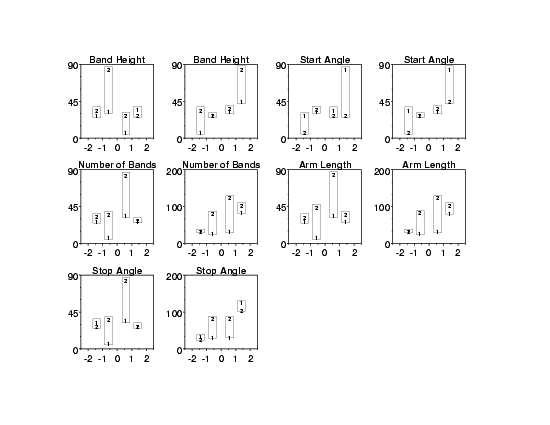
For the current design, the full set of block plots would use each factor as the primary factor, and then each combination of the remaining factors with one left out. For a 25-1 design, this would result in 5*4 = 20 block plots. As this can become overwhelming for routine use, we can often generate just a subset of these plots. For the current case, we generate two block plots for each factor (2*5=10 block plots) as the primary factor. On each of these plots, two of the remaining four factors are used as the nusciance factors.
- X1 is statistically significant. 2 is larger than 1 in 7 out of 8 cases. The probability of that (or worse) happening by chance is (8 + 1) / 256 = 3.5%.
- From plots 3 and 4, factor X2 has 2 > 1 in 3 out of 8 cases. This is not statistically significant.
- From plots 5 and 6, factor X3 has 2 > 1 in 8 out of 8 cases. This is statistically significant at the 1% level.
- From plots 7 and 8, factor X4 has 2 > 1 in 8 out of 8 cases. This is also statistically significant.
- From plots 9 and 10, factor X5 has 2 > 1 in 4 out of 8 cases. This is not statistically significant.
- From plots 5 and 6, the height of the vertical bar (the local factor 3 estimated effect) is large when X1*X2 = -1 and small when X1*X2 = +1 thereby implying an X3*X1*X2 interaction.


