1.3. EDA Techniques
1.3.3. Graphical Techniques: Alphabetic
1.3.3.20. |
Mean Plot |
Detect changes in location between groups
Mean plots can be used with ungrouped data to determine if the mean is changing over time. In this case, the data are split into an arbitrary number of equal-sized groups. For example, a data series with 400 points can be divided into 10 groups of 40 points each. A mean plot can then be generated with these groups to see if the mean is increasing or decreasing over time.
Although the mean is the most commonly used measure of location, the same concept applies to other measures of location. For example, instead of plotting the mean of each group, the median or the trimmed mean might be plotted instead. This might be done if there were significant outliers in the data and a more robust measure of location than the mean was desired.
Mean plots are typically used in conjunction with standard deviation plots. The mean plot checks for shifts in location while the standard deviation plot checks for shifts in scale.

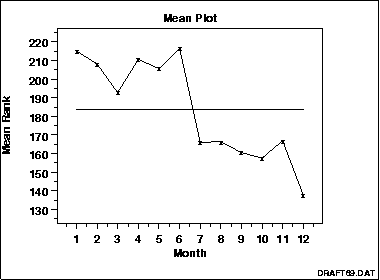
This sample mean plot shows a shift of location after the 6th month.
Group Means Versus Group ID
- Vertical axis: Group mean
- Horizontal axis: Group identifier
- Are there any shifts in location?
- What is the magnitude of the shifts in location?
- Is there a distinct pattern in the shifts in location?
Checking Assumptions
DOE Mean Plot
Box Plot

