Next Page Previous Page Home Tools & Aids Search Handbook

1. Exploratory Data Analysis
1.3. EDA Techniques
1.3.3. Graphical Techniques: Alphabetic

1.3.3.12.

DOE Mean Plot

Purpose:
Detect Important Factors With Respect to Location
The DOE mean plot is appropriate for analyzing data from a designed experiment, with respect to important factors, where the factors are at two or more levels. The plot shows mean values for the two or more levels of each factor plotted by factor. The means for a single factor are connected by a straight line. The DOE mean plot is a complement to the traditional analysis of variance of designed experiments.

This plot is typically generated for the mean. However, it can be generated for other location statistics such as the median.

Sample Plot:
Factors 4, 2, and 1 Are the Most Important Factors
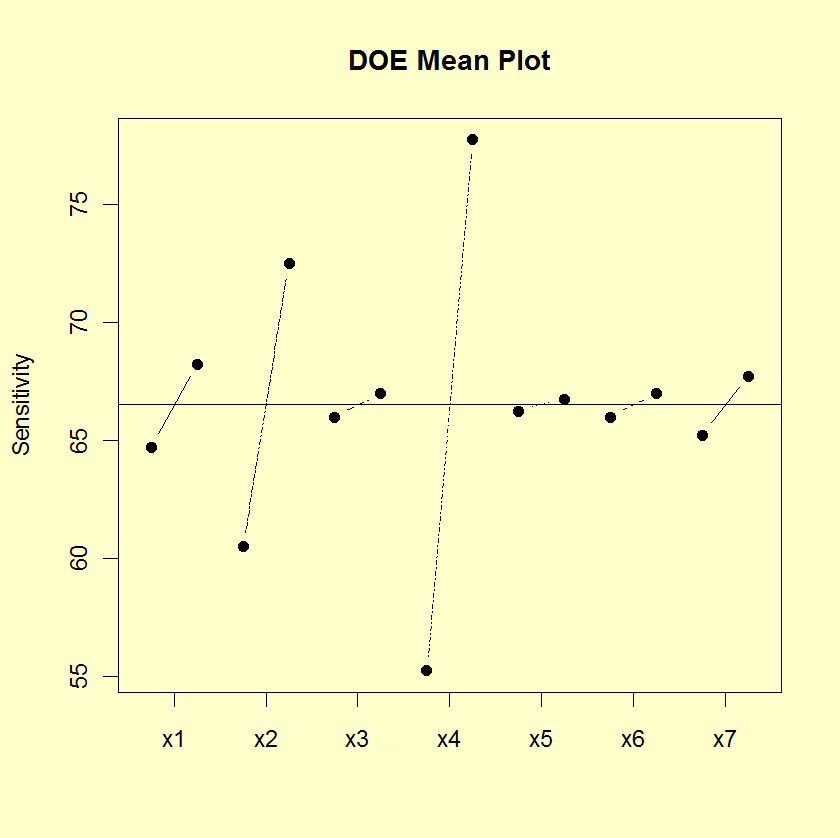
sample DOE mean plot

This sample DOE mean plot of the BOXBIKE2.DAT data set shows that:

  1. factor 4 is the most important;
  2. factor 2 is the second most important;
  3. factor 1 is the third most important;
  4. factor 7 is the fourth most important;
  5. factor 6 is the fifth most important;
  6. factors 3 and 5 are relatively unimportant.
In summary, factors 4, 2, and 1 seem to be clearly important, factors 3 and 5 seem to be clearly unimportant, and factors 6 and 7 are borderline factors whose inclusion in any subsequent models will be determined by further analyses.
Definition:
Mean Response Versus Factor Variables
DOE mean plots are formed by:
  • Vertical axis: Mean of the response variable for each level of the factor
  • Horizontal axis: Factor variable
Questions The DOE mean plot can be used to answer the following questions:
  1. Which factors are important? The DOE mean plot does not provide a definitive answer to this question, but it does help categorize factors as "clearly important", "clearly not important", and "borderline importance".
  2. What is the ranking list of the important factors?
Importance:
Determine Significant Factors
The goal of many designed experiments is to determine which factors are significant. A ranked order listing of the important factors is also often of interest. The DOE mean plot is ideally suited for answering these types of questions and we recommend its routine use in analyzing designed experiments.
Extension for Interaction Effects Using the concept of the scatter plot matrix, the DOE mean plot can be extended to display first-order interaction effects.

Specifically, if there are k factors, we create a matrix of plots with k rows and k columns. On the diagonal, the plot is simply a DOE mean plot with a single factor. For the off-diagonal plots, measurements at each level of the interaction are plotted versus level, where level is Xi times Xj and Xi is the code for the ith main effect level and Xj is the code for the jth main effect. For the common 2-level designs (i.e., each factor has two levels) the values are typically coded as -1 and 1, so the multiplied values are also -1 and 1. We then generate a DOE mean plot for this interaction variable. This plot is called a DOE interaction effects plot and an example is shown below.
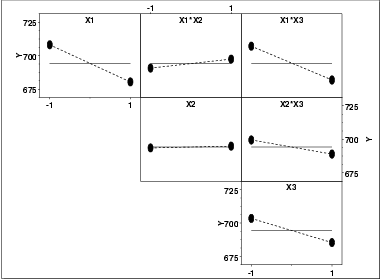
DOE Interaction Effects Plot a DOE interaction effects plot

This plot shows that the most significant factor is X1 and the most significant interaction is between X1 and X3.

Related Techniques DOE scatter plot
DOE standard deviation plot
Block plot
Box plot
Analysis of variance
Case Study The DOE mean plot and the DOE interaction effects plot are demonstrated in the ceramic strength data case study.
Software DOE mean plots are available in some general purpose statistical software programs, although the format may vary somewhat between these programs. It may be feasible to write macros for DOE mean plots in some statistical software programs that do not support this plot directly.
Home Tools & Aids Search Handbook Previous Page Next Page