1.3. EDA Techniques
1.3.5. Quantitative Techniques
1.3.5.17. Detection of Outliers
1.3.5.17.3. |
Generalized ESD Test for Outliers |
Detection of Outliers
The primary limitation of the Grubbs test and the Tietjen-Moore test is that the suspected number of outliers, k, must be specified exactly. If k is not specified correctly, this can distort the conclusions of these tests. On the other hand, the generalized ESD test (Rosner 1983) only requires that an upper bound for the suspected number of outliers be specified.
The generalized ESD test is defined for the hypothesis:
| H0: | There are no outliers in the data set |
| Ha: | There are up to r outliers in the data set |
| Test Statistic: |
Compute
with \(\bar{x}\) and s denoting the sample mean and sample standard deviation, respectively. Remove the observation that maximizes \(|x_{i} - \bar{x}|\) and then recompute the above statistic with n - 1 observations. Repeat this process until r observations have been removed. This results in the r test statistics R1, R2, ..., Rr. |
| Significance Level: | α |
| Critical Region: |
Corresponding to the r test statistics, compute
the following r critical values
where tp,ν is the 100p percentage point from the t distribution with ν degrees of freedom and
The number of outliers is determined by finding the largest i such that Ri > λi. Simulation studies by Rosner indicate that this critical value approximation is very accurate for n ≥ 25 and reasonably accurate for n ≥ 15. |
Note that although the generalized ESD is essentially Grubbs test applied sequentially, there are a few important distinctions:
- The generalized ESD test makes approriate adjustments
for the critical values based on the number of outliers
being tested for that the sequential application of Grubbs
test does not.
- If there is significant masking, applying Grubbs test sequentially may stop too soon. The example below identifies three outliers at the 5 % level when using the generalized ESD test. However, trying to use Grubbs test sequentially would stop at the first iteration and declare no outliers.
         -0.25 0.68 0.94 1.15 1.20 1.26 1.26
          1.34 1.38 1.43 1.49 1.49 1.55 1.56
          1.58 1.65 1.69 1.70 1.76 1.77 1.81
          1.91 1.94 1.96 1.99 2.06 2.09 2.10
          2.14 2.15 2.23 2.24 2.26 2.35 2.37
          2.40 2.47 2.54 2.62 2.64 2.90 2.92
          2.92 2.93 3.21 3.26 3.30 3.59 3.68
          4.30 4.64 5.34 5.42 6.01
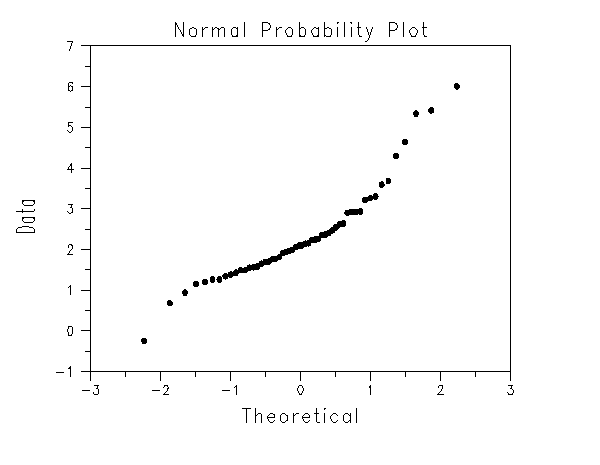
As a first step, a normal probability plot was generated

This plot indicates that the normality assumption is questionable.
Following the Rosner paper, we test for up to 10 outliers:
      H0:  there are no outliers in the data
      Ha:  there are up to 10 outliers in the data

      Significance level:  α = 0.05
      Critical region:  Reject H0 if Ri > critical value

      Summary Table for Two-Tailed Test
      ---------------------------------------
            Exact           Test     Critical
        Number of      Statistic    Value, λi
      Outliers, i      Value, Ri          5 %
      ---------------------------------------
              1          3.118          3.158
              2          2.942          3.151
              3          3.179          3.143 *
              4          2.810          3.136
              5          2.815          3.128
              6          2.848          3.120
              7          2.279          3.111
              8          2.310          3.103
              9          2.101          3.094
             10          2.067          3.085
For the generalized ESD test above, there are essentially 10
separate tests being performed. For this example, the largest number of outliers
for which the test statistic is greater than the critical value (at the 5 % level)
is three. We therefore conclude that there are three outliers in this data set.
- How many outliers does the data set contain?
Checking for outliers should be a routine part of any data analysis. Potential outliers should be examined to see if they are possibly erroneous. If the data point is in error, it should be corrected if possible and deleted if it is not possible. If there is no reason to believe that the outlying point is in error, it should not be deleted without careful consideration. However, the use of more robust techniques may be warranted. Robust techniques will often downweight the effect of outlying points without deleting them.

