1.3. EDA Techniques
1.3.5. Quantitative Techniques
1.3.5.17. Detection of Outliers
1.3.5.17.2. |
Tietjen-Moore Test for Outliers |
Detection of Outliers
The Tietjen-Moore test is a generalization of the Grubbs' test to the case of multiple outliers. If testing for a single outlier, the Tietjen-Moore test is equivalent to the Grubbs' test.
It is important to note that the Tietjen-Moore test requires that the suspected number of outliers be specified exactly. If this is not known, it is recommended that the generalized extreme studentized deviate test be used instead (this test only requires an upper bound on the number of suspected outliers).
| H0: | There are no outliers in the data set |
| Ha: | There are exactly k outliers in the data set |
| Test Statistic: |
Sort the n data points from smallest to the largest
so that yi denotes the ith largest
data value.
The test statistic for the k largest points is
with \(\bar{y}\) denoting the sample mean for the full sample and \(\bar{y}_{k}\) denoting the sample mean with the largest k points removed. The test statistic for the k smallest points is
with \(\bar{y}\) denoting the sample mean for the full sample and \(\bar{y}_{k}\) denoting the sample mean with the smallest k points removed. To test for outliers in both tails, compute the absolute residuals
and then let zi denote the yi values sorted by their absolute residuals in ascending order. The test statistic for this case is
with \(\bar{z}\) denoting the sample mean for the full data set and \(\bar{z}_{k}\) denoting the sample mean with the largest k points removed. |
| Significance Level: | α |
| Critical Region: |
The critical region for the Tietjen-Moore test is determined
by simulation. The simulation is performed by generating
a standard normal random sample of size n and
computing the Tietjen-Moore test statistic. Typically,
10,000 random samples are used. The value of the
Tietjen-Moore statistic obtained from the data is compared
to this reference distribution.
The value of the test statistic is between zero and one. If there are no outliers in the data, the test statistic is close to 1. If there are outliers in the data, the test statistic will be closer to zero. Thus, the test is always a lower, one-tailed test regardless of which test statisic is used, Lk or Ek. |
-
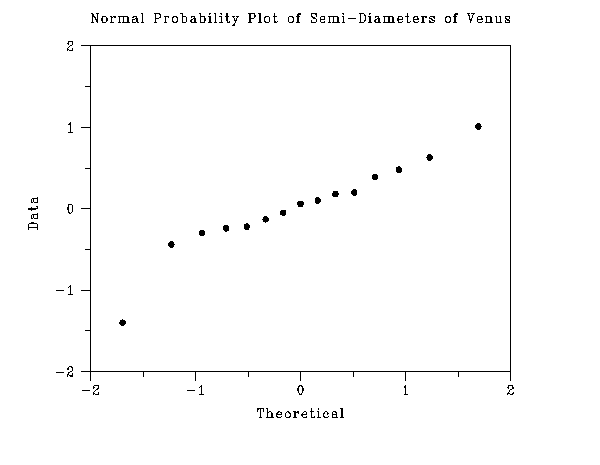
-1.40 -0.44 -0.30 -0.24 -0.22 -0.13 -0.05 0.06 0.10
0.18 0.20 0.39 0.48 0.63 1.01

This plot indicates that the normality assumption is reasonable. The minimum value appears to be an outlier. To a lesser extent, the maximum value may also be an outlier. The Tietjen-Moore test of the two most extreme points (-1.40 and 1.01) is shown below.
      H0:  there are no outliers in the data
      Ha:  the two most extreme points are outliers

      Test statistic:  Ek = 0.292
      Significance level:  α = 0.05
      Critical value for lower tail:  0.317
      Critical region:  Reject H0 if Ek < 0.317
The Tietjen-Moore test is a lower, one-tailed test, so we reject
the null hypothesis that there are no outliers when the value of the
test statistic is less than the critical value. For our example,
the null hypothesis is rejected at the 0.05 level of significance
and we conclude that the two most extreme points are outliers.
- Does the data set contain k outliers?
Checking for outliers should be a routine part of any data analysis. Potential outliers should be examined to see if they are possibly erroneous. If the data point is in error, it should be corrected if possible and deleted if it is not possible. If there is no reason to believe that the outlying point is in error, it should not be deleted without careful consideration. However, the use of more robust techniques may be warranted. Robust techniques will often downweight the effect of outlying points without deleting them.

