1.
Exploratory Data Analysis
1.3.
EDA Techniques
1.3.3.
Graphical Techniques: Alphabetic
|
|
Purpose:
Check for randomness
|
A lag plot checks whether a data set or time series
is random or not. Random data should not exhibit any
identifiable structure in the lag plot. Non-random structure
in the lag plot indicates that the underlying data are not
random. Several common patterns for lag plots are shown in the
examples below.
|
|
Sample Plot
|
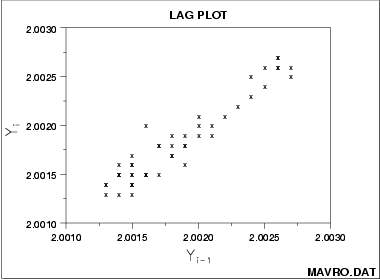
This sample lag plot of the MAVRO.DAT
data set exhibits a linear pattern. This shows
that the data are strongly non-random and further suggests that
an autoregressive model might be appropriate.
|
|
Definition
|
A lag is a fixed time displacement. For example,
given a data set Y1, Y2 ...,
Yn, Y2 and
Y7 have lag 5 since 7 - 2 = 5. Lag plots can
be generated for any arbitrary lag, although the most commonly
used lag is 1.
A plot of lag 1 is a plot of the values of Yi
versus Yi-1
- Vertical axis: Yi for all i
- Horizontal axis: Yi-1 for all i
|
|
Questions
|
Lag plots can provide answers to the following questions:
- Are the data random?
- Is there serial correlation in the data?
- What is a suitable model for the data?
- Are there outliers in the data?
|
|
Importance
|
Inasmuch as randomness is an underlying assumption for
most statistical estimation and testing techniques,
the lag plot should be a routine tool for researchers.
|
|
Examples
|
|
|
Related Techniques
|
Autocorrelation Plot
Spectrum
Runs Test
|
|
Case Study
|
The lag plot is demonstrated in the
beam deflection
data case study.
|
|
Software
|
Lag plots are not directly available in most general purpose
statistical software programs. Since the lag plot is essentially
a scatter plot with the 2 variables properly lagged, it should be
feasible to write a macro for the lag plot in most statistical
programs.
|

