
|
|
JSCOREName:
This command takes as input a response variable containing the z-score and a corresponding variable that identifies the round-id for each z-score. Since the ISO 13528 standard contains several different options for computing z-scores from raw data, it is assumed that the response variable has already been converted to z-scores. There are two versions of this command. One is used when there is a single material and the other is used for the case where there are multiple materials. Each combination of material and round will be referred to as a cell. One j-score is computed for each cell. For a given material, the j-score will be cumulative over the rounds. The j-score is computed as follows:
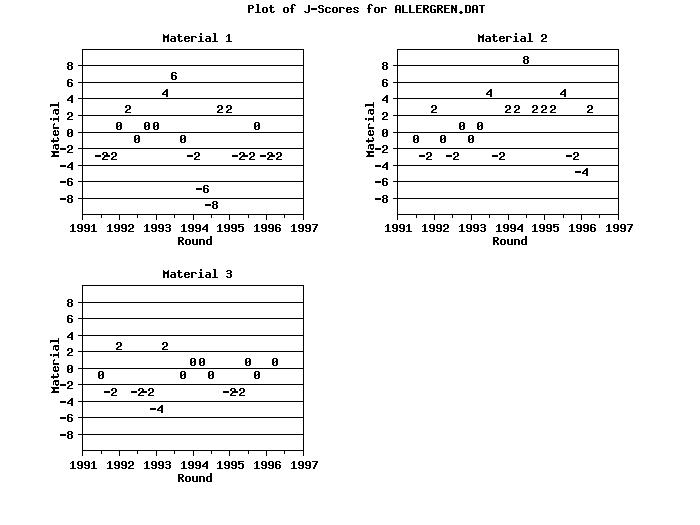
Although the j-score is not part of the 13528 standard, it has been recommended in analyzing 13528-based proficiency studies (see the Thompson and Jaehn references below). The j-score combines properties of both the mean control chart and the cusum control charts. Specifically, it can detect both abrupt changes (i.e., j-scores for a given round > 8 or < -8) and drift in the result (i.e., several successive positive j-scores or several successive negative j-scores). The j-scores are typically used as a diagnostic to determine when a laboratory is producing results inconsistent with other laboratories in the proficiency study. It is an alternative to the ISO 13528 control charts.
where <z> is a response variable containing z-scores; <roundid> is a variable containing the round-id; <y> is a variable that contains the computed j-scores; and where the <SUBSET/EXCEPT/FOR qualification> is optional. The <z> and <roundid> variables should have the same length. The length of the <y> variable is equal to the number of distinct values in the <roundid> variable. If the data has multiple materials and/or laboratories, the SUBSET command can be used to specify the specific material and laboratory. Since this syntax generates a vector of numbers rather than a parameter, it cannot be used in the 20+ commands that can use Dataplot's built-in statistics.
<SUBSET/EXCEPT/FOR qualification> where <z> is a response variable containing z-scores; <roundid> is a variable containing the round-id; <matid> is a variable containing the material-id; <y> is a variable that contains the computed j-scores; <rndout> is a variable that contains the round-id for the computed j-scores; <matout> is a variable that contains the material-id for the computed j-scores; and where the <SUBSET/EXCEPT/FOR qualification> is optional. The <z>, <roundid>, and <matid> variables should have the same length. The length of the <y>, <rndout>, and <matout> variables is equal to the number of distinct values in the <roundid> variable times the number of distinct values in the <matid> variable minus the number of empty cells. This syntax is used for the case of multiple materials and a single laboratory. If the data has multiple laboratories, the SUBSET command can be used to specify the specific laboratory. Since this syntax generates a vector of numbers rather than a parameter, it cannot be used in the 20+ commands that can use Dataplot's built-in statistics.
where <z> is a response variable containing z-scores; <a> is a parameter that contains the computed j-score is saved; and where the <SUBSET/EXCEPT/FOR qualification> is optional. This syntax assumes a single round, a single material, and a single laboratory. It returns a single j-score as a parameter and can be used in the 20+ commands that can use Dataplot's built-in statistics. The word STATISTIC is required to distinguish this from Syntax 1. NOTE: Since the j-score is cumulative over rounds, this syntax is not particuarly useful. It returns the initial j-score for the material/round cell.
LET Y = JSCORE Z ROUND SUBSET LAB = 23 SUBSET MATERIAL = 3
LET A = JSCORE Z SUBSET ROUND = 2 SUBSET LAB = 23 SUBSET MATERIAL = 3
To specify that the extreme value should be used, enter
To specify that the average value should be used, enter
Jaehn (1991), "The Zone Control Chart", Quality Progress, 24, pp. 65-68. ISO 13528 (2005), "Statistical Methods for use in proficiency testing by interlaboratory comparisons," First Edition, 2005-09-01. Howarth, Richard J. (2003), "The J-chart: a simple plot that combines the capabilities of Shewart and cusum charts, for use in analytical quality control," AMC Technical Brief, Royal Society of Chemistry, No. 12.
Control Charts
. Step 1:   Read the data.  Note that this data set only has the
.           data for a single year.  Plot in the format shown in
.           the Horwath paper.
.
dimension 40 columns
skip 25
read allergen.dat z labid matid year quarter
skip 0
let denom = 4
let tempid = (quarter-1)/denom
let roundid = year + tempid
set write decimals 3
.
. Step 2:   Demonstrate Syntax 2
.
let jscore rndout matout = jscore table z roundid  matid
print rndout matout z jscore
The following outout is generated
 ------------------------------------------------------------
          RNDOUT         MATOUT              Z         JSCORE
 ------------------------------------------------------------
        1991.500          1.000         -1.400         -2.000
        1991.750          1.000         -0.900         -2.000
        1992.000          1.000          0.200          0.000
        1992.250          1.000          1.000          2.000
        1992.500          1.000         -0.400          0.000
        1992.750          1.000          0.000          0.000
        1993.000          1.000          0.900          0.000
        1993.250          1.000          2.000          4.000
        1993.500          1.000          1.700          6.000
        1993.750          1.000         -0.800          0.000
        1994.000          1.000         -1.000         -2.000
        1994.250          1.000         -2.000         -6.000
        1994.500          1.000         -1.600         -8.000
        1994.750          1.000          1.500          2.000
        1995.000          1.000          0.100          2.000
        1995.250          1.000         -1.900         -2.000
        1995.500          1.000         -0.700         -2.000
        1995.750          1.000          0.300          0.000
        1996.000          1.000         -1.300         -2.000
        1996.250          1.000         -0.400         -2.000
        1991.500          2.000         -0.200          0.000
        1991.750          2.000         -1.300         -2.000
        1992.000          2.000          1.600          2.000
        1992.250          2.000         -0.500          0.000
        1992.500          2.000         -1.200         -2.000
        1992.750          2.000          0.300          0.000
        1993.000          2.000         -0.100          0.000
        1993.250          2.000          0.300          0.000
        1993.500          2.000          2.600          4.000
        1993.750          2.000         -1.300         -2.000
        1994.000          2.000          1.600          2.000
        1994.250          2.000          0.800          2.000
        1994.500          2.000          4.000         10.000
        1994.750          2.000          1.100          2.000
        1995.000          2.000          0.300          2.000
        1995.250          2.000          0.100          2.000
        1995.500          2.000          1.200          4.000
        1995.750          2.000         -1.900         -2.000
        1996.000          2.000         -1.100         -4.000
        1996.250          2.000          1.900          2.000
        1991.500          3.000         -0.500          0.000
        1991.750          3.000         -1.000         -2.000
        1992.000          3.000          1.000          2.000
        1992.500          3.000         -1.500         -2.000
        1992.750          3.000         -0.800         -2.000
        1993.000          3.000         -1.100         -4.000
        1993.250          3.000          1.000          2.000
        1993.750          3.000         -0.600          0.000
        1994.000          3.000          0.400          0.000
        1994.250          3.000          0.400          0.000
        1994.500          3.000         -0.800          0.000
        1995.000          3.000         -1.500         -2.000
        1995.250          3.000         -0.500         -2.000
        1995.500          3.000          0.400          0.000
        1995.750          3.000         -0.800          0.000
        1996.250          3.000          0.000          0.000
.
. Step 3:   Plot jscore statistic - set plot control setting
.
case asis
label case asis
title case asis
title offset 2
.
line blank all
.
y1label Material
ylimits -8 8
major ytic mark number 9
minor ytic mark number 0
tic mark offset units data
y1tic mark offset 2 2
ygrid on
grid pattern dotted
x1label Round
x1label displacement 12
.
multiplot scale factor 2
multiplot corner coordinates 5 5 95 95
multiplot 2 2
.
let jscore = 8  subset jscore > 8
let jscore = -8 subset jscore < -8
.
let nmat = unique matid
loop for k = 1 1 nmat
    title Material ^k
    let j2 = jscore
    let r2 = rndout
    let j2b = j2 + 0.8  subset z >= 0
    let j2b = j2 - 0.8  subset z <  0
    retain j2 j2b r2    subset matid = ^k
    let tag = code j2
    let jtemp = distinct j2
    let jtemp = sort jtemp
    character automatic jtemp
    plot j2b r2 tag
end of loop
end of multiplot
.
justification center
move 50 97
text Plot of J-Scores for ALLERGREN.DAT
|
Privacy
Policy/Security Notice
NIST is an agency of the U.S.
Commerce Department.
Date created: 02/09/2015 | |||||||||||||||||||||||||||||||||||||||||||||||||||||||||||||