
|
ISO 13528 PLOTName:
Although the proficiency test may have multiple materials, this plot is restricted to a single material. Then for the labs identified in LAB2, the plot is formed as:
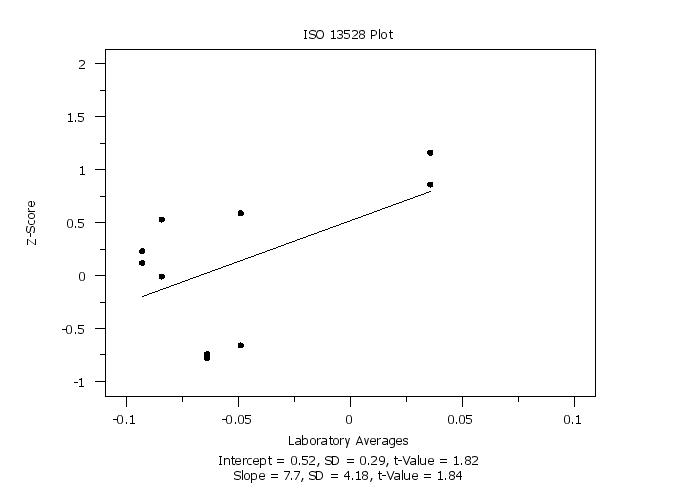
Although this plot is most typically generated for a single laboratory, it can also be used to plot the z-scores for multiple laboratories. In addition, a line is fit to the plot points. The primary question for the fitted line is whether there is any trend (i.e., is the slope parameter for the fitted line statistically significant). A separate line is fit for each laboratory specified by the &;lt;LAB2> variable. What is used for the Y variable is dependent on what data is available to you. If you have the original raw data (i.e., before z-scores were computed), then this is typically what you would use (i.e., let Dataplot compute the laboratory averages). However, in some cases you may not have the original data. There are two cases:
See the Note section below for details on how to specify which case is being used. You can optionally specify a material-id variable. This is essentially a highlighting variable. That is, different materials can be drawn with different plot characters (this is demonstrated in the Program example below).
<SUBSET/EXCEPT/FOR qualification> where <y> is the response variable in the original units; <z> is the z-scores of the response variable; <roundid> is a variable that specifies the round-id; <labid> is a variable that specifies the lab-id; <lab2> is a variable that specifies the laboratories for which the plot will be generated; and where the <SUBSET/EXCEPT/FOR qualification> is optional.
<SUBSET/EXCEPT/FOR qualification> where <y> is the response variable in the original units; <z> is the z-scores of the response variable; <roundid> is a variable that specifies the round-id; <labid> is a variable that specifies the lab-id; <matid> is a variable that specifies the mat-id; <lab2> is a variable that specifies the laboratories for which the plot will be generated; and where the <SUBSET/EXCEPT/FOR qualification> is optional.
ISO 13528 PLOT Y Z ROUNDID LABID LAB2 ISO 13528 PLOT Y Z ROUNDID LABID LAB2 SUBSET MATID = 2
LINE BLANK SOLID BLANK SOLID BLANK SOLID CHARACTER 3 BLANK 5 BLANK ISO 13528 PLOT Y Z ROUNDID LABID LAB2 Note that these settings come in pairs. The second setting in the pair is for the fitted line. This is demonstrated in the program example below.
If you want the Y variable to contain either the original data or the z-scores, enter the command
SET ISO 13528 PLOT STATISTIC H15 To reset the default of using the mean, enter
. Step 1: Read the data (note that this sample data set only
.         has z-scores)
.
dimension 40 columns
skip 25
read turner.dat labid z year quarter matid matave
let roundid = year
skip 0
.
. Step 2: Some plot control settings
.
label case asis
y1label Z-Score
x1label Laboratory Averages
tic mark offset units screen
tic mark offset 3 3
.
case asis
title case asis
title offset 2
title ISO 13528 Plot
.
line blank solid
character circle blank
character hw 1 0.75
character fill on
.
. Step 3: Generate the plot for lab 3
.
set iso 13528 plot response
let lab2 = data 3
iso 13528 plot z z roundid labid lab2
.
. Step 4: Annotate the plot with the fit parameters
.
skip 1
read parameter dpst1f.dat ppa0 ppa1 ppa0sd ppa1sd a0tval a1tval
skip 0
let ppa0 = round(ppa0,2)
let ppa1 = round(ppa1,2)
let ppa0sd = round(ppa0sd,2)
let ppa1sd = round(ppa1sd,2)
let a0tval = round(a0tval,2)
let a1tval = round(a1tval,2)
just center
move 50 6
text Intercept = ^ppa0, SD = ^ppa0sd, t-Value = ^a0tval
move 50 3
text Slope = ^ppa1, SD = ^ppa1sd, t-Value = ^a1tval

.
. Step 5: Use the material-id
.
line blank all
character 1 2 3 4 5 6 7 8 9 10
character fill off
character hw
iso 13528 plot z z roundid labid matid lab2
| ||||||||||||||||||||||||||||||||||||||||||