
|
DIFFERENCE OF EXTREMEName:
For the difference of extremes, the extreme is computed for each of two samples then their difference is taken.
where <y1> is the first response variable; <y2> is the first response variable; <par> is a parameter where the computed difference of the extreme is stored; and where the <SUBSET/EXCEPT/FOR qualification> is optional.
LET A = DIFFERENCE OF EXTREME Y1 Y2 SUBSET X > 1
SKIP 25
READ IRIS.DAT Y1 TO Y4 X
.
LET A = DIFFERENCE OF EXTREME Y1 Y2
TABULATE DIFFERENCE OF EXTREME Y1 Y2 X
.
XTIC OFFSET 0.2 0.2
X1LABEL GROUP ID
Y1LABEL DIFFERENCE OF EXTREME
CHAR X
LINE BLANK
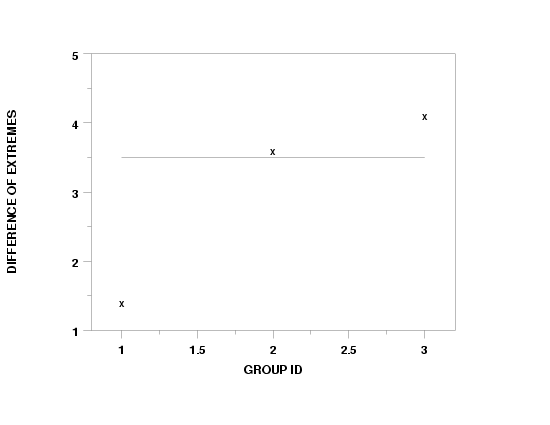
DIFFERENCE OF EXTREME PLOT Y1 Y2 X
CHAR X ALL
LINE BLANK ALL
BOOTSTRAP DIFFERENCE OF EXTREME PLOT Y1 Y2 X
Dataplot generated the following output.
       *******************************************
       **  LET A = DIFFERENCE OF EXTREME Y1 Y2  **
       *******************************************


 THE COMPUTED VALUE OF THE CONSTANT A             =  0.35000000E+01


       **********************************************
       **  TABULATE DIFFERENCE OF EXTREME Y1 Y2 X  **
       **********************************************


                 *    Y1       AND Y2
     X           *    DIFFERENCE OF EXTREMES
 **********************************************
     1.00000     *     1.40000
     2.00000     *     3.60000
     3.00000     *     4.10000

       GROUP-ID AND STATISTIC WRITTEN TO FILE DPST1F.DAT

|
Privacy
Policy/Security Notice
NIST is an agency of the U.S.
Commerce Department.
Date created: 03/27/2003 | ||||||||||||||||||||||||||||||