
|
|
BOOTSTRAP PLOTName:
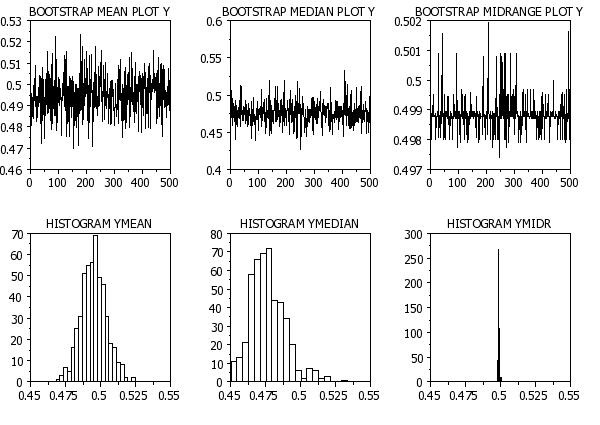
For the bootstrap plot, the vertical axis contains the computed value of the statistic and the horizontal axis contains the sample number (for k = 1, 2, ..., N). The number of response variables depends on the number of variables required to compute the statistic (e.g., the MEAN uses one while the LINEAR INTERCEPT uses two). The bootstrap plot is typically followed by some type of distributional plot such as a histogram. Dataplot also supports BOOTSTRAP computations for the case when there is one group variable. In this case, the horizontal axis is group id and the vertical axis contains the computed values of the statistic for that group. The number of bootstrap samples is applied to each group. For example,if the requested number of bootstrap samples is 100, then each group will have 100 bootstrap samples applied. For a list of supported statistics in Dataplot, enter
<SUBSET/EXCEPT/FOR qualification> where <y1> ... <yk> is a list of 1 to 3 response variables (depending on <stat>); <stat> is one of Dataplot's supported statistics; and where the <SUBSET/EXCEPT/FOR qualification> is optional. This syntax is used for the no group-id's case.
<SUBSET/EXCEPT/FOR qualification> where <y1> ... <yk> is a list of 1 to 3 response variables (depending on <stat>); <x> is a group id variable; <stat> is one of Dataplot's supported statistics; and where the <SUBSET/EXCEPT/FOR qualification> is optional. This syntax is used for the case when there is one group-id variable.
<SUBSET/EXCEPT/FOR qualification> where <y1> ... <yk> is a list of 1 to 3 response variables (depending on <stat>); <x1> is the first group id variable; <x2> is the second group id variable; <stat> is one of Dataplot's supported statistics; and where the <SUBSET/EXCEPT/FOR qualification> is optional. This syntax is used for the case when there are two group-id variables.
BOOTSTRAP LINEAR SLOPE PLOT Y1 X1 BOOTSTRAP MEAN PLOT Y TAG BOOTSTRAP MEAN PLOT Y TAG SUBSET TAG > 2 BOOTSTRAP DIFFERENCE OF MEAN PLOT Y1 Y2 TAG
to specify whether you have paired or unpaired response variables. The default is INDEPENDENT (i.e., unpaired).
QUADRATIC CALIBRATION
The values are typically used in setting confidence intervals. Note that for the replication case (i.e., you have a group id variable), the above quantities are computed using all the groups. In most cases, you will want these quantities for each group. See the Note section below regarding information written to DPST1F.DAT, DPST2F.DAT, and DPST3F.DAT.
These files are useful if you want to perform further processing on the bootstrap samples. For example, you can generate histograms of the bootstrap samples.
The regular BOOTSTRAP PLOT command generates confidence intervals based on the percentiles of the bootstrap statistics. This method of computing confidence intervals, referred to as the percentile bootstrap, is first order accurate for confidence intervals. Section 14.3 of Efron and Tibshirani discuss the BCa method of generating bootstrap confidence intervals that is second order accurate. BCa is an abbreviation for "acceleration" and "bias-correction". The BCa confidence interval is given by:
where
If \( \hat{\mbox{a}} \) and \( \hat{\mbox{z}}_{0} \) are zero, the BCa confidence interval reduces to the percentile bootstrap. Non-zero values change the percentiles used for the BCa interval. The BCa confidence interval above depends on \( \hat{\mbox{a}} \) and \( \hat{\mbox{z}}_{0} \). The \( \hat{\mbox{z}}_{0} \) is the bias correction and \( \hat{\mbox{a}} \) is the acceleration. The value of \( \hat{\mbox{z}}_{0} \). is computed by
where
To compute \( \hat{\mbox{a}} \), let \( \hat{\theta}_{i} \) be the estimate of the statistic of interest with the i-th point deleted (i.e., the jackknife values). Let \( \hat{\theta}_{.} \) equal the mean of the \( \hat{\theta}_{i} \). Then \( \hat{\mbox{a}} \) can be computed by
The details of the BCa method are explained in more detail in Efron and Tibshirani. To have Dataplot generate BCa confidence intervals, enter a command like
For the BCA BOOTSTRAP, Dataplot will generate the same plot as if the BCA option was not given. It will write the following values to the file dpst3f.dat (in the current directory):
These values are written to a single row. If you have the group case, one row is written for each group. The confidence interval printed is for the 95% two-sided case. If you want a different significance level or a one-sided interval, you can read these values into Dataplot to compute the interval (see the relevant definitions above). To read these values back into Dataplot, you can enter the commands
SKIP 6 SET READ FORMAT 4E15.7,2F8.4,2F10.0 READ PARAMETER DPST1F.DAT LCL UCL ZOHAT A0HAT ALPHA1 ALPHA2 Note that you can use the BCA option with all of the syntax options given above.
Efron and Tibshirabi (1993), "An Introduction to the Bootstrap", Springer-Verlang.
1998/5: added the saving of the parameters (BMEAN, BSD, etc.) 2001/3: added GEOMETRIC MEAN, GEOMETRIC STANDARD DEVIATION, HARMONIC MEAN 2001/9: added IQ RANGE 2001/11: added BIWEIGHT LOCATION, BIWEIGHT SCALE 2002/7: activated CORRELATION, COVARIANCE, RANK CORRELATION, RANK COVARIANCE 2002/7: added LINEAR CALIBRTION, QUADRATIC CALIBRATION, WINSORIZED VARIANCE, WINSORIZED CORRELATION, WINSORIZED COVARIANCE, BIWEIGHT MIDVARIANCE, BIWEIGHT MIDCOVARIANCE, PERCENTAGE BEND MIDVARIANCE, PERCENTAGE BEND CORRELATION, HODGE LEHMAN, TRIMMED MEAN STANDARD ERROR, QUANTILE, QUANTILE STANDARD ERROR 2003/3: added support for the "DIFFERENCE OF" statistics 2003/3: added documentation for the replication (i.e., groups) case 2003/5: Added support for SN SCALE, QN SCALE, DIFFERENCE OF SN, DIFFERENCE OF QN 2004/1: Added support for two group variables 2004/1: Added support for BCA BOOTSTRAP commands 2010/3: Added support for tabular report in addition to the plot
LET Y = UNIFORM RANDOM NUMBERS FOR I = 1 1 1000
BOOTSTRAP SAMPLE SIZE 500
MULTIPLOT CORNER COORDINATES 0 0 100 100
MULTIPLOT SCALE FACTOR 2
MULTIPLOT 2 3
TITLE AUTOMATIC
BOOTSTRAP MEAN PLOT Y
LET YMEAN = YPLOT
BOOTSTRAP MEDIAN PLOT Y
LET YMEDIAN = YPLOT
BOOTSTRAP MIDRANGE PLOT Y
LET YMIDR = YPLOT
XLIMITS 0.45 0.55
HISTOGRAM YMEAN
HISTOGRAM YMEDIAN
HISTOGRAM YMIDR
END OF MULTIPLOT
 Program 2:
SKIP 25
READ GEAR.DAT Y X
XLIMITS 1 10
MAJOR XTIC MARK NUMBER 10
MINOR XTIC MARK NUMBER 0
XTIC OFFSET 0.5 0.5
TIC OFFSET UNITS DATA
X1LABEL BATCH
Y1LABEL BOOTSTRAP ESTIMATES OF THE MEAN
CHARACTER CIRCLE ALL
CHARACTER HW 0.5 0.375 ALL
CHARACTER FILL ON ALL
LINE BLANK ALL
SET WRITE DECIMALS 4
BOOTSRAP MEAN PLOT Y X
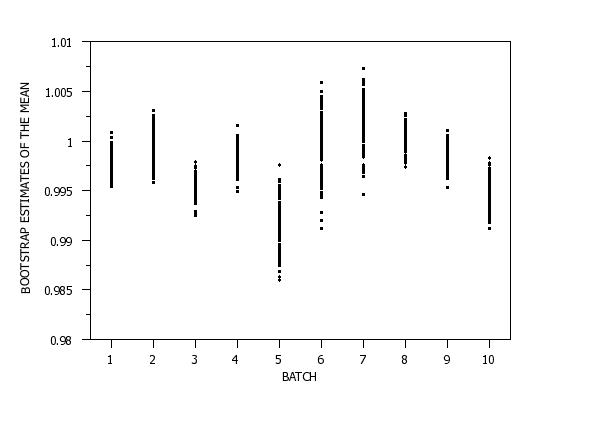
Bootstrap Analysis for the MEAN
Response Variable One: Y
Group ID Variable One (X ): 1.0000
Number of Bootstrap Samples: 100
Number of Observations: 10
Mean of Bootstrap Samples: 0.9979
Standard Deviation of Bootstrap Samples: 0.0011
Median of Bootstrap Samples: 0.9978
MAD of Bootstrap Samples: 0.0008
Minimum of Bootstrap Samples: 0.9954
Maximum of Bootstrap Samples: 1.0008
Percent Points of the Bootstrap Samples
-----------------------------------
Percent Point Value
-----------------------------------
0.1 = 0.9954
0.5 = 0.9954
1.0 = 0.9954
2.5 = 0.9955
5.0 = 0.9958
10.0 = 0.9961
20.0 = 0.9970
50.0 = 0.9978
80.0 = 0.9991
90.0 = 0.9993
95.0 = 0.9996
97.5 = 1.0001
99.0 = 1.0008
99.5 = 1.0008
99.9 = 1.0008
Percentile Confidence Interval for Statistic
------------------------------------------
Confidence Lower Upper
Coefficient Limit Limit
------------------------------------------
50.00 0.9972 0.9988
75.00 0.9962 0.9993
90.00 0.9958 0.9996
95.00 0.9955 1.0001
99.00 0.9954 1.0008
99.90 0.9954 1.0008
------------------------------------------
Response Variable One: Y
Group ID Variable One (X ): 2.0000
Number of Bootstrap Samples: 100
Number of Observations: 10
Mean of Bootstrap Samples: 0.9993
Standard Deviation of Bootstrap Samples: 0.0016
Median of Bootstrap Samples: 0.9994
MAD of Bootstrap Samples: 0.0011
Minimum of Bootstrap Samples: 0.9957
Maximum of Bootstrap Samples: 1.0031
Percent Points of the Bootstrap Samples
-----------------------------------
Percent Point Value
-----------------------------------
0.1 = 0.9957
0.5 = 0.9957
1.0 = 0.9958
2.5 = 0.9963
5.0 = 0.9966
10.0 = 0.9972
20.0 = 0.9978
50.0 = 0.9994
80.0 = 1.0005
90.0 = 1.0016
95.0 = 1.0021
97.5 = 1.0024
99.0 = 1.0030
99.5 = 1.0031
99.9 = 1.0031
Percentile Confidence Interval for Statistic
------------------------------------------
Confidence Lower Upper
Coefficient Limit Limit
------------------------------------------
50.00 0.9982 1.0003
75.00 0.9974 1.0012
90.00 0.9966 1.0021
95.00 0.9963 1.0024
99.00 0.9957 1.0031
99.90 0.9957 1.0031
------------------------------------------
Response Variable One: Y
Group ID Variable One (X ): 3.0000
Number of Bootstrap Samples: 100
Number of Observations: 10
Mean of Bootstrap Samples: 0.9955
Standard Deviation of Bootstrap Samples: 0.0010
Median of Bootstrap Samples: 0.9955
MAD of Bootstrap Samples: 0.0007
Minimum of Bootstrap Samples: 0.9925
Maximum of Bootstrap Samples: 0.9978
Percent Points of the Bootstrap Samples
-----------------------------------
Percent Point Value
-----------------------------------
0.1 = 0.9925
0.5 = 0.9925
1.0 = 0.9925
2.5 = 0.9927
5.0 = 0.9937
10.0 = 0.9942
20.0 = 0.9946
50.0 = 0.9955
80.0 = 0.9964
90.0 = 0.9968
95.0 = 0.9973
97.5 = 0.9975
99.0 = 0.9978
99.5 = 0.9978
99.9 = 0.9978
Percentile Confidence Interval for Statistic
------------------------------------------
Confidence Lower Upper
Coefficient Limit Limit
------------------------------------------
50.00 0.9948 0.9962
75.00 0.9942 0.9967
90.00 0.9937 0.9973
95.00 0.9927 0.9975
99.00 0.9925 0.9978
99.90 0.9925 0.9978
------------------------------------------
Response Variable One: Y
Group ID Variable One (X ): 4.0000
Number of Bootstrap Samples: 100
Number of Observations: 10
Mean of Bootstrap Samples: 0.9981
Standard Deviation of Bootstrap Samples: 0.0011
Median of Bootstrap Samples: 0.9980
MAD of Bootstrap Samples: 0.0007
Minimum of Bootstrap Samples: 0.9949
Maximum of Bootstrap Samples: 1.0016
Percent Points of the Bootstrap Samples
-----------------------------------
Percent Point Value
-----------------------------------
0.1 = 0.9949
0.5 = 0.9949
1.0 = 0.9949
2.5 = 0.9957
5.0 = 0.9962
10.0 = 0.9967
20.0 = 0.9972
50.0 = 0.9980
80.0 = 0.9991
90.0 = 0.9996
95.0 = 1.0001
97.5 = 1.0005
99.0 = 1.0015
99.5 = 1.0016
99.9 = 1.0016
Percentile Confidence Interval for Statistic
------------------------------------------
Confidence Lower Upper
Coefficient Limit Limit
------------------------------------------
50.00 0.9973 0.9990
75.00 0.9969 0.9995
90.00 0.9962 1.0001
95.00 0.9957 1.0005
99.00 0.9949 1.0016
99.90 0.9949 1.0016
------------------------------------------
Response Variable One: Y
Group ID Variable One (X ): 5.0000
Number of Bootstrap Samples: 100
Number of Observations: 10
Mean of Bootstrap Samples: 0.9919
Standard Deviation of Bootstrap Samples: 0.0022
Median of Bootstrap Samples: 0.9921
MAD of Bootstrap Samples: 0.0015
Minimum of Bootstrap Samples: 0.9860
Maximum of Bootstrap Samples: 0.9976
Percent Points of the Bootstrap Samples
-----------------------------------
Percent Point Value
-----------------------------------
0.1 = 0.9860
0.5 = 0.9860
1.0 = 0.9860
2.5 = 0.9866
5.0 = 0.9878
10.0 = 0.9887
20.0 = 0.9902
50.0 = 0.9921
80.0 = 0.9937
90.0 = 0.9949
95.0 = 0.9954
97.5 = 0.9959
99.0 = 0.9975
99.5 = 0.9976
99.9 = 0.9976
Percentile Confidence Interval for Statistic
------------------------------------------
Confidence Lower Upper
Coefficient Limit Limit
------------------------------------------
50.00 0.9904 0.9932
75.00 0.9892 0.9947
90.00 0.9878 0.9954
95.00 0.9866 0.9959
99.00 0.9860 0.9976
99.90 0.9860 0.9976
------------------------------------------
Response Variable One: Y
Group ID Variable One (X ): 6.0000
Number of Bootstrap Samples: 100
Number of Observations: 10
Mean of Bootstrap Samples: 0.9989
Standard Deviation of Bootstrap Samples: 0.0028
Median of Bootstrap Samples: 0.9989
MAD of Bootstrap Samples: 0.0019
Minimum of Bootstrap Samples: 0.9911
Maximum of Bootstrap Samples: 1.0059
Percent Points of the Bootstrap Samples
-----------------------------------
Percent Point Value
-----------------------------------
0.1 = 0.9911
0.5 = 0.9911
1.0 = 0.9912
2.5 = 0.9924
5.0 = 0.9945
10.0 = 0.9955
20.0 = 0.9965
50.0 = 0.9989
80.0 = 1.0013
90.0 = 1.0027
95.0 = 1.0040
97.5 = 1.0047
99.0 = 1.0058
99.5 = 1.0059
99.9 = 1.0059
Percentile Confidence Interval for Statistic
------------------------------------------
Confidence Lower Upper
Coefficient Limit Limit
------------------------------------------
50.00 0.9971 1.0009
75.00 0.9957 1.0021
90.00 0.9945 1.0040
95.00 0.9924 1.0047
99.00 0.9911 1.0059
99.90 0.9911 1.0059
------------------------------------------
Response Variable One: Y
Group ID Variable One (X ): 7.0000
Number of Bootstrap Samples: 100
Number of Observations: 10
Mean of Bootstrap Samples: 1.0016
Standard Deviation of Bootstrap Samples: 0.0025
Median of Bootstrap Samples: 1.0016
MAD of Bootstrap Samples: 0.0018
Minimum of Bootstrap Samples: 0.9946
Maximum of Bootstrap Samples: 1.0072
Percent Points of the Bootstrap Samples
-----------------------------------
Percent Point Value
-----------------------------------
0.1 = 0.9946
0.5 = 0.9946
1.0 = 0.9946
2.5 = 0.9966
5.0 = 0.9970
10.0 = 0.9984
20.0 = 0.9993
50.0 = 1.0016
80.0 = 1.0040
90.0 = 1.0048
95.0 = 1.0056
97.5 = 1.0060
99.0 = 1.0072
99.5 = 1.0072
99.9 = 1.0072
Percentile Confidence Interval for Statistic
------------------------------------------
Confidence Lower Upper
Coefficient Limit Limit
------------------------------------------
50.00 1.0000 1.0036
75.00 0.9986 1.0046
90.00 0.9970 1.0056
95.00 0.9966 1.0060
99.00 0.9946 1.0072
99.90 0.9946 1.0072
------------------------------------------
Response Variable One: Y
Group ID Variable One (X ): 8.0000
Number of Bootstrap Samples: 100
Number of Observations: 10
Mean of Bootstrap Samples: 1.0003
Standard Deviation of Bootstrap Samples: 0.0010
Median of Bootstrap Samples: 1.0001
MAD of Bootstrap Samples: 0.0005
Minimum of Bootstrap Samples: 0.9974
Maximum of Bootstrap Samples: 1.0028
Percent Points of the Bootstrap Samples
-----------------------------------
Percent Point Value
-----------------------------------
0.1 = 0.9974
0.5 = 0.9974
1.0 = 0.9974
2.5 = 0.9979
5.0 = 0.9982
10.0 = 0.9990
20.0 = 0.9996
50.0 = 1.0001
80.0 = 1.0010
90.0 = 1.0018
95.0 = 1.0021
97.5 = 1.0026
99.0 = 1.0027
99.5 = 1.0028
99.9 = 1.0028
Percentile Confidence Interval for Statistic
------------------------------------------
Confidence Lower Upper
Coefficient Limit Limit
------------------------------------------
50.00 0.9998 1.0009
75.00 0.9991 1.0016
90.00 0.9982 1.0021
95.00 0.9979 1.0026
99.00 0.9974 1.0028
99.90 0.9974 1.0028
------------------------------------------
Response Variable One: Y
Group ID Variable One (X ): 9.0000
Number of Bootstrap Samples: 100
Number of Observations: 10
Mean of Bootstrap Samples: 0.9982
Standard Deviation of Bootstrap Samples: 0.0012
Median of Bootstrap Samples: 0.9982
MAD of Bootstrap Samples: 0.0009
Minimum of Bootstrap Samples: 0.9953
Maximum of Bootstrap Samples: 1.0011
Percent Points of the Bootstrap Samples
-----------------------------------
Percent Point Value
-----------------------------------
0.1 = 0.9953
0.5 = 0.9953
1.0 = 0.9953
2.5 = 0.9957
5.0 = 0.9963
10.0 = 0.9966
20.0 = 0.9971
50.0 = 0.9982
80.0 = 0.9995
90.0 = 0.9998
95.0 = 1.0000
97.5 = 1.0005
99.0 = 1.0010
99.5 = 1.0011
99.9 = 1.0011
Percentile Confidence Interval for Statistic
------------------------------------------
Confidence Lower Upper
Coefficient Limit Limit
------------------------------------------
50.00 0.9972 0.9992
75.00 0.9967 0.9998
90.00 0.9963 1.0000
95.00 0.9957 1.0005
99.00 0.9953 1.0011
99.90 0.9953 1.0011
------------------------------------------
Response Variable One: Y
Group ID Variable One (X ): 10.0000
Number of Bootstrap Samples: 100
Number of Observations: 10
Mean of Bootstrap Samples: 0.9946
Standard Deviation of Bootstrap Samples: 0.0015
Median of Bootstrap Samples: 0.9947
MAD of Bootstrap Samples: 0.0010
Minimum of Bootstrap Samples: 0.9911
Maximum of Bootstrap Samples: 0.9982
Percent Points of the Bootstrap Samples
-----------------------------------
Percent Point Value
-----------------------------------
0.1 = 0.9911
0.5 = 0.9911
1.0 = 0.9911
2.5 = 0.9912
5.0 = 0.9920
10.0 = 0.9925
20.0 = 0.9933
50.0 = 0.9947
80.0 = 0.9959
90.0 = 0.9967
95.0 = 0.9975
97.5 = 0.9978
99.0 = 0.9982
99.5 = 0.9982
99.9 = 0.9982
Percentile Confidence Interval for Statistic
------------------------------------------
Confidence Lower Upper
Coefficient Limit Limit
------------------------------------------
50.00 0.9936 0.9957
75.00 0.9927 0.9965
90.00 0.9920 0.9975
95.00 0.9912 0.9978
99.00 0.9911 0.9982
99.90 0.9911 0.9982
------------------------------------------
Response Variable One: Y
Group ID Variable One (All Data):
Number of Bootstrap Samples: 100
Number of Observations: 100
Mean of Bootstrap Samples: 0.9976
Standard Deviation of Bootstrap Samples: 0.0032
Median of Bootstrap Samples: 0.9978
MAD of Bootstrap Samples: 0.0020
Minimum of Bootstrap Samples: 0.9860
Maximum of Bootstrap Samples: 1.0072
Percent Points of the Bootstrap Samples
-----------------------------------
Percent Point Value
-----------------------------------
0.1 = 0.9860
0.5 = 0.9878
1.0 = 0.9887
2.5 = 0.9904
5.0 = 0.9918
10.0 = 0.9932
20.0 = 0.9952
50.0 = 0.9978
80.0 = 1.0001
90.0 = 1.0013
95.0 = 1.0026
97.5 = 1.0040
99.0 = 1.0049
99.5 = 1.0058
99.9 = 1.0072
Percentile Confidence Interval for Statistic
------------------------------------------
Confidence Lower Upper
Coefficient Limit Limit
------------------------------------------
50.00 0.9957 0.9998
75.00 0.9938 1.0009
90.00 0.9918 1.0026
95.00 0.9904 1.0040
99.00 0.9878 1.0058
99.90 0.9860 1.0072
------------------------------------------
Date created: 12/06/2010 |
Last updated: 12/04/2023 Please email comments on this WWW page to [email protected]. | |||||||||||||||||||||||||||||||||||||||||||||||||||||||||||||||||||||||||||||||||||