
|
|
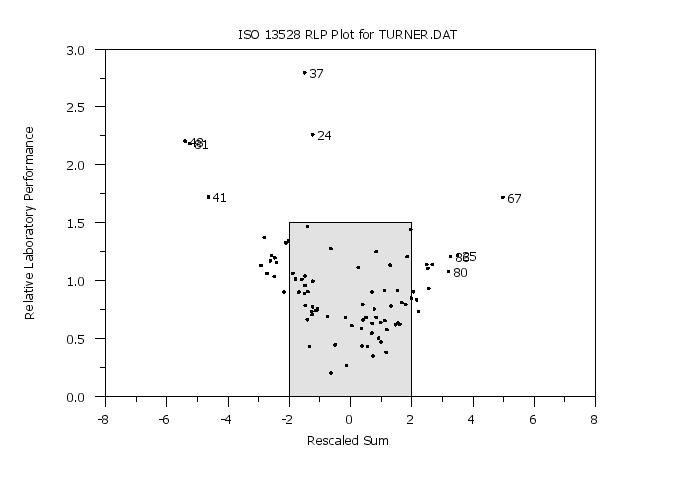
ISO 13528 RLP PLOTName:
For ISO 13528 multi-round proficiency studies, the relative laboratory performance (RLP) for a given laboratory with N z-scores (Zi) is defined as
where NMAT is the number of materials. An RLP near 1 indicates average performance and an RLP greater than 1.5 indicates that the laboratory may be problematic. An advantage of this statistic is that z-scores of opposite sign do not cancel each other out. A disadvantage is that this statistic is suspectible to outliers in the z-scores. The rescaled sum (RSZ) is defined as
So if there are k laboratories, the plot will consist of k points. For each laboratory, the RLP and RSZ are computed over all rounds and all materials. Note that the material id variable enters only in computing the number of distinct materials in the above formulas. A value of RSZ greater than 2 or less than -2 flags a warning signal with regard to the laboratory. A value of RSZ greater than 3 or less than -3 flags an "action" signal (i.e., similar to an out-of-control signal from a control chart) with regard to the laboratory. An advantage of this statistic is that it has the same interpretation as a z-score. The disadvantage is that z-scores of opposite sign can cancel each other. Laboratories where the RLP is greater than 1.5 and the |RSZ| > 2 are flagged as problematic. This command automatically defines a sub-region area based on this area. This is demonstrated in the Program example below. The RSZ statistic is discussed in Thompson, Ellison, and Wood (2006). The RLP statistic is discussed in Uhlig and Lischer (1998). The RLP and RSZ statistics are examples of combination scores (i.e., the statistic is a combination of many individual z-scores). Although the ISO 13528 standard recommends against using combination scores, these can be helpful in judging the overall performance of a laboratory. A useful way to use this plot is to identify laboratories that are potentially problematic. These laboratories can then be examined more carefully. For example: is the poor performance due to one or a few outliers? is the lab consistently high or consistently low? does the laboratory need to carefully examine their procedures?
<SUBSET/EXCEPT/FOR qualification> where <z> is a response variable containing z-scores; <labid> is a variable that specifies the lab-id; <matid> is a variable that specifies the material-id; and where the <SUBSET/EXCEPT/FOR qualification> is optional.
where
The default is none. The Program example below demonstrates the ACTION option. Note that you do not have to make any changes to the CHARACTER settings as Dataplot does this automatically. The CHARACTER OFFSET command can be helpful in this context (it is the CHARACTER OFFSET for the second trace that controls the positioning of the lables).
To specify this value, enter the command
where <value> is typically 3 or 4. Note that the value represents an absolute value. For example, if CAPVALUE is 4, values greater than 4 will be set to 4 and values less than -4 will be set to -4.
ISO 13528 (2005), "Statistical Methods for use in proficiency testing by interlaboratory comparisons," First Edition, 2005-09-01.
. Step 1:   Read the data
.
dimension 40 columns
skip 25
read turner.dat labid z year quarter matid matave
let roundid = year
skip 0
.
. Step 2:   Set plot control setting
.
case asis
title case asis
title offset 2
label case asis
y1label Relative Laboratory Performance
x1label Rescaled Sum
title ISO 13528 RLP Plot for TURNER.DAT
y1tic mark label decimal 1
xlimits -8  8
major xtic mark number 9
minor xtic mark number 1
x1tic mark offset 0 0
.
set rlp plot labels action
region fill on
region fill color g90
line blank
character circle
character hw 0.5 0.375
character fill on
character offset 0 0 2 0
.
. Step 3:   Generate plot
.
iso 13528 rlp plot z labid matid
Date created: 02/18/2015 |
Last updated: 12/04/2023 Please email comments on this WWW page to [email protected]. | ||||||||||||||||||||||||||||||||||||||||||||||||||||