1.4. EDA Case Studies
1.4.2. Case Studies
1.4.2.4. Josephson Junction Cryothermometry
1.4.2.4.2. |
Graphical Output and Interpretation |
- Determine if the univariate model:
-
\( Y_{i} = C + E_{i} \)
is appropriate and valid.
- Determine if the typical underlying assumptions for an
"in control" measurement process are valid. These assumptions
are:
- random drawings;
- from a fixed distribution;
- with the distribution having a fixed location; and
- the distribution having a fixed scale.
- Determine if the confidence interval
-
\( \bar{Y} \pm 2s/\sqrt{N} \)
is appropriate and valid where s is the standard deviation of the original data.
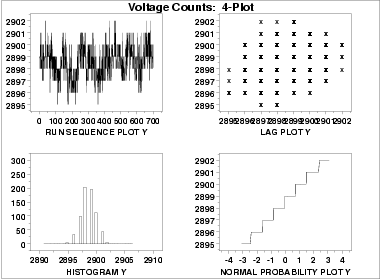
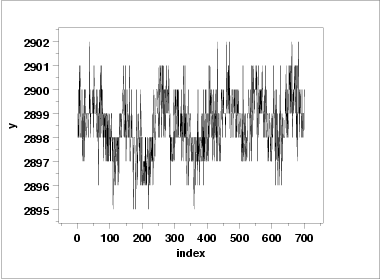
- The run sequence plot
(upper left) indicates that the data do not
have any significant shifts in location or scale over time.
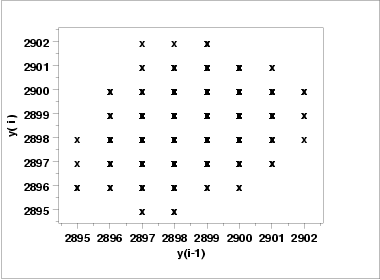
- The lag plot
(upper right) does not indicate any non-random
pattern in the data.
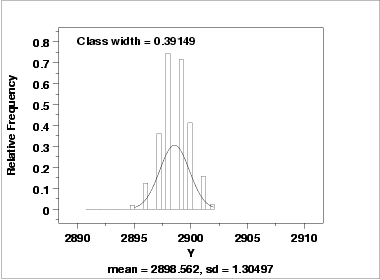
- The histogram
(lower left) shows that the data are reasonably
symmetric, there does not appear to be significant outliers in
the tails, and that it is reasonable to assume that the data
can be fit with a normal distribution.
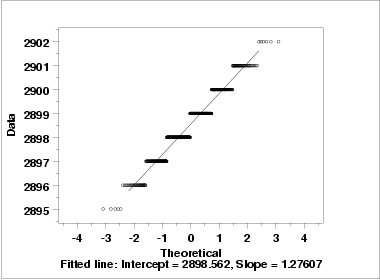
- The normal probability plot (lower right) is difficult to interpret due to the fact that there are only a few distinct values with many repeats.
From the above plots, we conclude that the underlying assumptions are valid and the data can be reasonably approximated with a normal distribution. Therefore, the commonly used uncertainty standard is valid and appropriate. The numerical values for this model are given in the Quantitative Output and Interpretation section.
