1.
Exploratory Data Analysis
1.3.
EDA Techniques
1.3.3.
Graphical Techniques: Alphabetic
1.3.3.25.
|
Run-Sequence Plot
|
|
Purpose:
Check for Shifts in Location and Scale
and Outliers
|
Run sequence plots
(Chambers 1983)
are an easy way to graphically summarize a
univariate data set. A common assumption of univariate data
sets is that they behave like:
- random drawings;
- from a fixed distribution;
- with a common location; and
- with a common scale.
With run sequence plots, shifts in location and
scale are typically quite evident. Also, outliers
can easily be detected.
|
Sample Plot:
Last Third of Data Shows a Shift of
Location
|
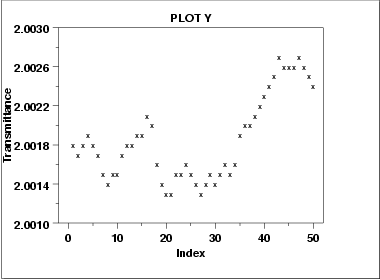
This sample run sequence plot of
the MAVRO.DAT data set
shows that the location shifts up for the last third of the data.
|
Definition:
y(i) Versus i
|
Run sequence plots are formed by:
- Vertical axis: Response variable Yi
- Horizontal axis: Index i (i = 1, 2, 3, ... )
|
Questions
|
The run sequence plot can be used to answer the following
questions
- Are there any shifts in location?
- Are there any shifts in variation?
- Are there any outliers?
The run sequence plot can also give the analyst an excellent
feel for the data.
|
Importance:
Check Univariate Assumptions
|
For univariate data, the default model is
where the error is assumed to be random,
from a fixed distribution, and with constant
location and scale. The validity of this
model depends on the validity of these assumptions.
The run sequence plot is useful for checking for
constant location and scale.
Even for more complex models, the assumptions
on the error term are still often the same. That is,
a run sequence plot of the residuals (even from
very complex models) is still vital for checking
for outliers and for detecting shifts in location and scale.
|
|
Related Techniques
|
Scatter Plot
Histogram
Autocorrelation Plot
Lag Plot
|
|
Case Study
|
The run sequence plot is demonstrated in the
Filter transmittance data
case study.
|
|
Software
|
Run sequence plots are available in most general purpose
statistical software programs.
|

