Next Page Previous Page Home Tools & Aids Search Handbook
1. Exploratory Data Analysis
1.3. EDA Techniques
1.3.3. Graphical Techniques: Alphabetic

1.3.3.27.

Spectral Plot

Purpose:
Examine Cyclic Structure
A spectral plot ( Jenkins and Watts 1968 or Bloomfield 1976) is a graphical technique for examining cyclic structure in the frequency domain. It is a smoothed Fourier transform of the autocovariance function.

The frequency is measured in cycles per unit time where unit time is defined to be the distance between 2 points. A frequency of 0 corresponds to an infinite cycle while a frequency of 0.5 corresponds to a cycle of 2 data points. Equi-spaced time series are inherently limited to detecting frequencies between 0 and 0.5.

Trends should typically be removed from the time series before applying the spectral plot. Trends can be detected from a run sequence plot. Trends are typically removed by differencing the series or by fitting a straight line (or some other polynomial curve) and applying the spectral analysis to the residuals.

Spectral plots are often used to find a starting value for the frequency, ω, in the sinusoidal model

    \[ Y_{i} = C + \alpha\sin{(2\pi\omega t_{i} + \phi)} + E_{i} \]
See the beam deflection case study for an example of this.
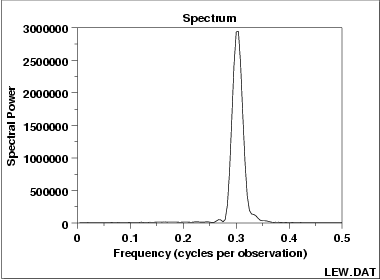
Sample Plot spectral plot showing one dominant frequency

This spectral plot of the LEW.DAT data set shows one dominant frequency of approximately 0.3 cycles per observation.

Definition:
Variance Versus Frequency
The spectral plot is formed by:
  • Vertical axis: Smoothed variance (power)
  • Horizontal axis: Frequency (cycles per observation)
The computations for generating the smoothed variances can be involved and are not discussed further here. The details can be found in the Jenkins and Bloomfield references and in most texts that discuss the frequency analysis of time series.
Questions The spectral plot can be used to answer the following questions:
  1. How many cyclic components are there?
  2. Is there a dominant cyclic frequency?
  3. If there is a dominant cyclic frequency, what is it?
Importance
Check Cyclic Behavior of Time Series
The spectral plot is the primary technique for assessing the cyclic nature of univariate time series in the frequency domain. It is almost always the second plot (after a run sequence plot) generated in a frequency domain analysis of a time series.
Examples
  1. Random (= White Noise)
  2. Strong autocorrelation and autoregressive model
  3. Sinusoidal model
Related Techniques Autocorrelation Plot
Complex Demodulation Amplitude Plot
Complex Demodulation Phase Plot
Case Study The spectral plot is demonstrated in the beam deflection data case study.
Software Spectral plots are a fundamental technique in the frequency analysis of time series. They are available in many general purpose statistical software programs.
Home Tools & Aids Search Handbook Previous Page Next Page