1.3. EDA Techniques
1.3.3. Graphical Techniques: Alphabetic
1.3.3.27. Spectral Plot
1.3.3.27.1. |
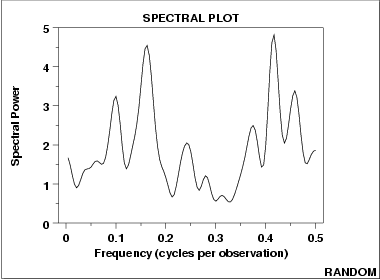
Spectral Plot: Random Data |

- There are no dominant peaks.
- There is no identifiable pattern in the spectrum.
- The data are random.

|
1.
Exploratory Data Analysis
1.3. EDA Techniques 1.3.3. Graphical Techniques: Alphabetic 1.3.3.27. Spectral Plot
|
|||
| Spectral Plot of 200 Normal Random Numbers |

|
||
| Conclusions |
We can make the following conclusions from the above plot of
200 normal random numbers.
|
||
| Discussion | For random data, the spectral plot should show no dominant peaks or distinct pattern in the spectrum. For the sample plot above, there are no clearly dominant peaks and the peaks seem to fluctuate at random. This type of appearance of the spectral plot indicates that there are no significant cyclic patterns in the data. | ||
