SED navigation bar go to SED home page go to Dataplot home page go to NIST home page SED Home Page SED Staff SED Projects SED Products and Publications Search SED Pages
Dataplot Vol 2 Vol 1

NORMAL KERNEL DENSITY MIXTURE

Name:
    NORMAL KERNEL DENSITY MIXTURE (LET)
Type:
    Let Subcommand
Purpose:
    Given a set of means and associated uncertainties, compute the mixture of their normal kernels.
Description:
    Data for reference materials, interlaboratory studies, and key comparisons is often given as a mean and an associated standard deviation. It is often assumed that the data for each laboratory is from a normal distribution.

    This command does the following:

    1. For each individual laboratory, compute the \( \bar{y} \pm 4s \) points where \( \bar{y} \) and s denote the mean and standard deviation of the laboratory.

    2. Find the minimum and maximum value of these points over all the laboratories. Define a grid of 1,000 equally spaced points between the minimum and maximum point.

    3. At each grid point, compute the normal probability density function (PDF) for each laboratory (each laboratory will use its own mean and standard deviation for the parameters of the normal distribution). The PDF values for all laboratories are summed and then the value at the grid point is normalized by dividing by the number of laboratories.
Syntax:
    LET <y> <x> = NORMAL KERNEL DENSITY MIXTURE <ymean> <ysd>
                            <SUBSET/EXCEPT/FOR qualification>
    where <ymean> is a variable containing laboratory means;
                <ysd> is a variable containing the standard uncertainties associated with the <ymean> variable;
                <x> is a variable containing the values where the normal kernel density mixture values are computed;
                <y> is a variable containing the normal kernel density mixture values;
    and where the <SUBSET/EXCEPT/FOR qualification> is optional.
Examples:
    LET YKERN XKERN = NORMAL KERNEL DENSITY MIXTURE YMEAN YSD
    LET YKERN XKERN = NORMAL KERNEL DENSITY MIXTURE YMEAN YSD SUBSET TAG = 1
Default:
    None
Synonyms:
    None
Related Commands: Reference:
    Duewer (2008), "A Comparison of Location Estimators for Interlaboratory Data Contaminated with Value and Uncertainty Outliers", Accredited Quality Assurance, Vol. 13, pp. 193-216.
Applications:
    Consensus means, interlaboratory studies, key comparisons
Implementation Date:
    2017/02
Program:
     
    . Step 1:   Define the data
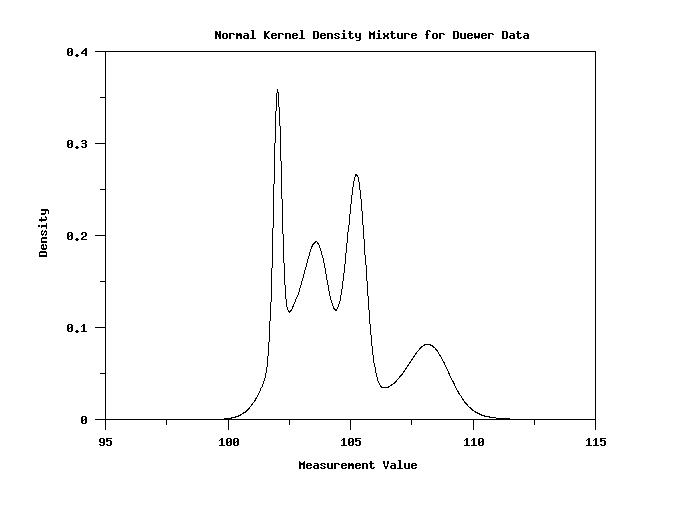
    .           (from David Duewer paper)
    .
    read ymean ysd
    102.02   0.16
    102.47   0.84
    102.98   0.90
    103.69   0.45
    104.08   1.16
    105.04   0.39
    105.36   0.32
    107.26   1.50
    108.26   0.77
    end of data
    .
    . Step 2:   Generate the normal kernel density mixture
    .
    let y x = normal kernel density mixture  ymean ysd
    .
    . Step 3:   Plot the result
    .
    label case asis
    title case asis
    title offset 2
    x1label Measurement Value
    y1label Density
    title Normal Kernel Density Mixture for Duewer Data
    xlimits 95 115
    .
    plot y x
        
    plot generated by sample program

Privacy Policy/Security Notice
Disclaimer | FOIA

NIST is an agency of the U.S. Commerce Department.

Date created: 07/20/2017
Last updated: 07/20/2017

Please email comments on this WWW page to alan.heckert@nist.gov.