
|
|
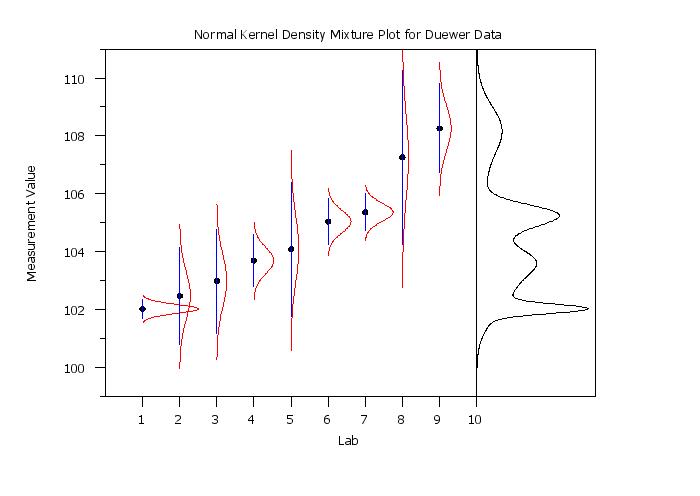
NORMAL KERNEL DENSITY MIXTURE PLOTName:
This command plots the following:
<SUBSET/EXCEPT/FOR qualification> where <ymean> is a response variable containg the means; <ysd> is a response variable containng the standard deviations; and where the <SUBSET/EXCEPT/FOR qualification> is optional.
NORMAL KERNEL DENSITY MIXTURE PLOT YMEAN YSD SUBSET YSD > 0
where <value> has a default value of 1. If <value> is less than 0.01, it will be set to 1. This expansion factor will be applied to all of the normal PDF curves. This is used for visual purposes only. It is the shape and height of the normal PDF curves relative to the other laboratories that is relevant in this graph. The expansion factor maintains this relative height.
The settings for trace 3 apply to all of the normal PDF curves for the individual laboratories. Likewise, the settings for trace 4 apply to all of the \( \bar{y} \pm 2 s \) lines.
. Step 1:   Read the data (from David Duewer paper)
.
skip 25
read duewer1.dat ymean ysd
.
. Step 2:   Set some plot control features
.
label case asis
title case asis
title offset 2
y1label Measurement Value
x1label Lab
title Normal Kernel Density Mixture Plot for Duewer Data
.
xlimits 1 10
major x1tic mark number 10
minor x1tic mark number 0
tic mark offset units data
x1tic mark offset 1 3.2
ylimits 100 110
major y1tic mark number 6
minor y1tic mark number 1
y1tic mark offset 1 1
horizontal switch on
.
line blank
line thickness 0.1 0.1 0.1 0.2
line color black black red blue
character circle
character hw 1 0.75
character fill on
.
normal kernel density mixture plot ymean ysd
.
line solid
drawdsds 10 20 10 90
Date created: 07/28/2017 |
Last updated: 12/04/2023 Please email comments on this WWW page to [email protected]. | |||||||||||||