SED navigation bar go to SED home page go to Dataplot home page go to NIST home page SED Home Page SED Staff SED Projects SED Products and Publications Search SED Pages
Dataplot Vol 2 Vol 1

EXTREME POINTS

Name:
    EXTREME POINTS
Type:
    LET Subcommand
Purpose:
    Given a set of points, return a list of extreme points.
Description:
    Given a set of (X,Y) points, return the four points

      (X1,YMIN)
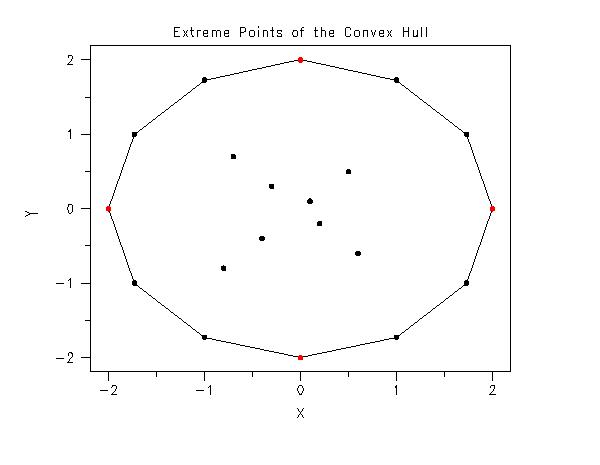
      (XMAX,Y2)
      (X3,YMAX)
      (XMIN,Y4)

    with XMIN, XMAX, YMIN, and YMAX denoting the minimum X value, the maximum X value, the minimum Y value, and the maximum Y value, respectively. The Xi and Yi mean the x or y coordinate corresponding to the minimum or maximum value.

Syntax:
    LET <yout> <xout>= EXTREME POINTS <y> <x>
                            <SUBSET/EXPCEPT/FOR qualification>
    where <y> is a variable containing the x-coordinates of the data points;
                <x> is a variable containing the y-coordinates of the data points;
                <yout> is a variable containing the y-coordinates of the extreme points;
                <xout> is a variable containing the x-coordinates of the extreme points;
    and where the <SUBSET/EXCEPT/FOR qualification> is optional.
Examples:
    LET Y2 X2 = EXTREME POINTS Y X
Default:
    None
Synonyms:
    None
Related Commands:
    POINTS IN POLYGON = Determine whether points are in the interior of a convex polygon.
    CONVEX HULL = Determine the convex hull of a set of points.
    TRANSFORM POINTS = Perform location, scale, and rotation transformation for a set of points.
    LINE INTERSECTIONS = Determine the intersection points for a set of lines.
    PARALLEL LINE = Determine the coordinates for a point that defines a parallel line determined by a point and a line defined by two points.
    PERPINDICULAR LINE = Determine the coordinates for a point that defines a perpindicular line determined by a point and a line defined by two points.
Applications:
    Computational Geometry
Implementation Date:
    2012/10
Program:
     
    .  Following data from Eddy's ACM article
    read x y
    2.0       0.0
    1.73      -1.0
    1.0       1.73
    0.0       2.0
    0.1       0.1
    -1.0      -1.73
    0.2       -0.2
    -1.73     1.0
    -0.3      0.3
    0.0       -2.0
    -0.4      -0.4
    -2.0      0.0
    0.5       0.5
    1.73      1.0
    0.6       -0.6
    -1.0      1.73
    -0.7      0.7
    -1.73     -1.0
    -0.8      -0.8
    1.0       -1.73
    end of data
    .
    let y2 x2 = 2d convex hull y x
    let y3 x3 = extreme points y2 x2
    let xtemp = x2(1)
    let ytemp = y2(1)
    let x2 = combine x2 xtemp
    let y2 = combine y2 ytemp
    .
    title case asis
    title offset 2
    title Extreme Points of the Convex Hull
    y1label Y
    x1label X
    tic offset units screen
    tic offset 3 3
    x3label
    .
    character hw 1 0.75 all
    character fill on all
    character color black black red
    character circle blank  circle
    line blank solid blank
    .
    pre-sort off
    plot y x and
    plot y2 x2 and
    plot y3 x3
    pre-sort on
        
    plot generated by sample program

Date created: 01/07/2013
Last updated: 01/13/2013
Please email comments on this WWW page to alan.heckert@nist.gov.