|
|
POINTS IN POLYGONName:
Given a set of one or more points, this command returns a tag value (where each row of the tag variable corresponds to the row of the variables containing the x and y coordinates of the points being tested). Each value of the tag variable will contain either a 1, 2, 3, or 4 where
2 = exterior point 3 = edge point 4 = vertex point
<SUBSET/EXPCEPT/FOR qualification> where <xval> is a variable containing the x-coordinates of the data points being checked; <yval> is a variable containing the y-coordinates of the data points being checked; <xpoly> is a variable that will contain the x-coordinats of the polygon; <ypoly> is a variable that will contain the y-coordinats of the polygon; <tag> is a variable (of the same size as <xval> and <yval>) that specifies whether each point is an interior, exterior, edge, or vertex point; and where the <SUBSET/EXCEPT/FOR qualification> is optional.
This algorithm is based on counting the number of ray tracings. A complete description of the algorithm is given on pages 239-245 of O'Rourke's book. This algorithm works for both convex and non-convex polygons.
The <xval> and <yval> points do not need to be in any specific order since they are tested independently of each other.
. Name: poly.dp
. Purpose: Demonstrate "points in polygon" routine
. Source: Data from O'Rourke (1998), "Computational Geometry in
. C", Second Edition.
.
. Step 1: Read data
.
read xpoly ypoly
0 0
2 0
2 2
3 1
4 2
5 2
3 3
3 2
2 4
6 3
7 4
7 2
8 5
8 7
7 7
8 8
5 9
6 6
5 7
4 6
4 8
3 7
2 7
3 6
4 4
0 7
2 3
0 2
end of data
.
read xval yval
0 0
1 0
2 1
1 2
0 2
6 2
2 4
5 4
1 5
3 5
6 5
7 6
8 6
1 7
2 7
3 7
4 7
4 8
5 9
end of data
.
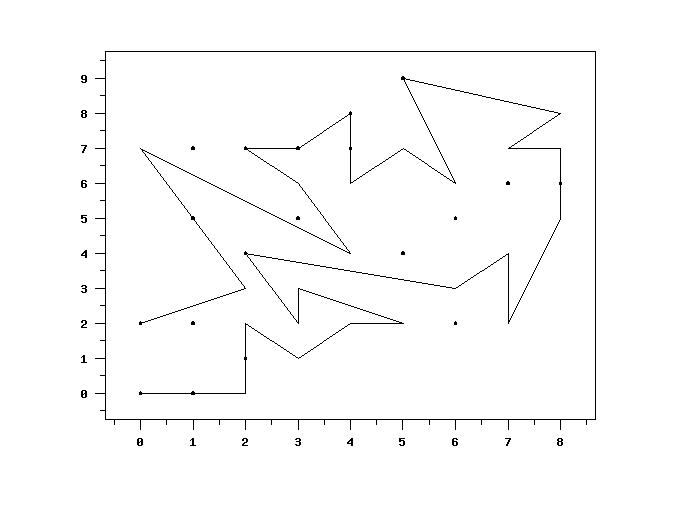
. Step 2: Plot data
.
tic mark offset units screen
tic mark offset 5 5
pre-sort off
line blank solid
character circ blank
character hw 0.5 0.375
character fill on
plot yval xval and
plot ypoly xpoly
pause
.
let tag = point in polygon xval yval xpoly ypoly
.
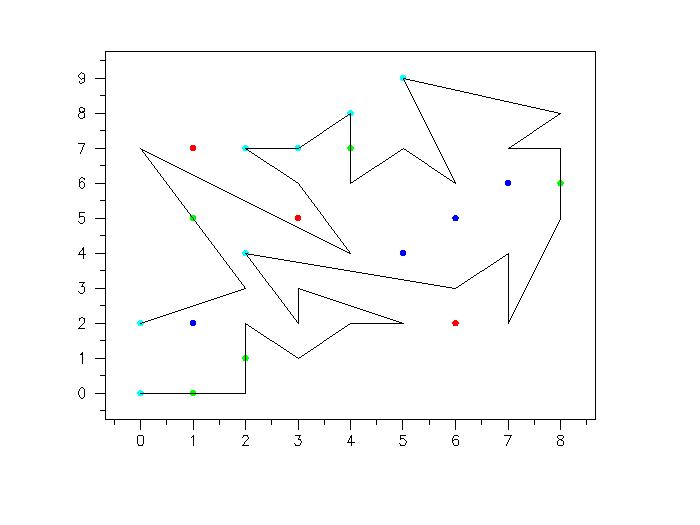
line bl bl bl bl solid
character circ circ circ circ blank
character hw 0.5 0.375 all
character fill on all
char color blue red green cyan black
plot yval xval subset tag = 1 and
plot yval xval subset tag = 2 and
plot yval xval subset tag = 3 and
plot yval xval subset tag = 4 and
plot ypoly xpoly
Date created: 09/14/2011 |