SUBSTITUTE CHARACTER
Name:
Type:
Purpose:
Specify the character to use as the substitution character.
Description:
Syntax:
SUBSTITUTE CHARACTER <char>
where <char> is the character to use as the substitute
character.
Examples:
SUBSTITUTE CHARACTER @
SUBSTITUTE CHARACTER ^
Note:
Generally it is not necessary to change the substitute character.
The one exception is if you want to define strings that contain
the default substitute character.
Note:
The substitute character can be used effectively with the LOOP
command. For example, assume that variables Y1 thru YN and
strings S1 and SN have been previously defined:
LOOP FOR K = 1 1 N
    TITLE Y^K VS X
    LEGEND 1 ^S^K
    PLOT Y^K VS X
END OF LOOP
Note the distinction between Y^K in the PLOT command and ^S^K in
the LEGEND command. For the plot command, we want PLOT Y1 VS X
while for the LEGEND command we want to insert the value of the
string S1. This is the reason that the Y^K has no preceding ^
while the ^S^K does.
Note:
The following characters are used to determine the end of the
parameter name:
|
|
-
|
a space
|
|
(
|
-
|
a left parenthesis
|
|
)
|
-
|
a right parenthesis
|
|
"
|
-
|
a quote character
|
|
&
|
-
|
an ampersand character
|
|
.
|
-
|
a period
|
|
^
|
-
|
another substitute character
|
|
,
|
-
|
a comma
|
|
:
|
-
|
a colon
|
|
;
|
-
|
a semi-colon
|
|
]
|
-
|
a right bracket
|
|
+
|
-
|
a plus
|
|
-
|
-
|
a minus
|
|
*
|
-
|
an asterisk
|
|
/
|
-
|
a forward slash
|
Note:
The substitution is performed before the command is interpreted.
Note:
If the parameter is undefined, it is replaced with a space
character in the command line.
Note:
The VALU() command also performs parameter substitution. However,
it only works for a few commands (specifically LEGEND, TITLE,
LABEL, and TEXT) while the substitute character works on any
command.
Note:
The substitute character can also be changed with the command
Note:
There may be occassions where you want to suppress the
character substitution. For examle, you may want to use
the "^" character in a string. You can suspend character
substitution with the command
SET COMMAND SUBSTITUTION OFF
To resume character substitution, enter
SET COMMAND SUBSTITUTION ON
Note:
If you are substituting for a parameter, there are several
ways you can control the appearance.
- You can use the ROUND command. For example,
LET CC = ROUND(CC,2)
LET STRING S = CORR: ^CC
- By default, parameters are expanded into numeric
format (e.g., 0.0017). If you would like the parameter
expanded in exponential format, enter the command
To restore the default, enter
SET PARAMETER EXPANSION NUMERIC
- For the most control, you can specify a Fortran
format by entering the command
For example,
SET SUBSTITUTION FORMAT F4.2
SET SUBSTITUTION FORMAT E15.7
To turn this off, enter
SET SUBSTITUTION FORMAT OFF
Dataplot uses the specified format with an internal Fortran
WRITE statement. That is
WRITE(ISTR,IFORMT,ERR=statement)VAL
where IFORMT is the specified format and VAL is the
value of the parameter. Dataplot does no parsing or
error checking on the specified format. Typically, only
F, E, or G formats should be used. If there is an error
using the Fortran format specification, Dataplot will
revert to its default parameter expansion (no error
message will be generated). The format string is limited
to a maximum of 8 characters and the maximum number of
characters for the expanded parameter is 20.
Default:
The default substitute character is ^ .
Synonyms:
Related Commands:
|
LOOP
|
=
|
Perform a loop.
|
|
VALU()
|
=
|
Perform parameter substitution within certain commands.
|
|
TERMINATOR CHARACTER
|
=
|
Define the character that terminates a command.
|
|
CONTINUE CHARACTER
|
=
|
Define the character that specifies that a command is
continued onto the next line.
|
|
SET SUBSTITUTE FORMAT
|
=
|
Specify a format for parameter substitution.
|
Applications:
Implementation Date:
Pre-1987
2000/01: Support for VARIABLE LABEL substitution
2007/09: Support for ^ROWLABEL^K
2019/01: Support for SET SUBSTITUTION FORMAT
2019/01: Support for SET COMMAND SUBSTITUTION
Program:
. Step 1: Read the data
.
skip 25
read weibbury.dat y
skip 0
.
. Step 2: Maximum likelihood estimates
.
set write decimals 5
weibull mle y
let gamma = gammaml
let pploc = 0
let ppscale = alphaml
.
title case asis
label case asis
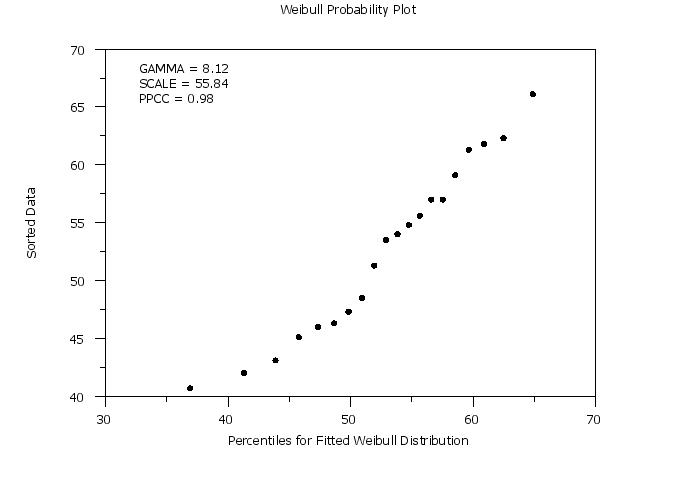
title Weibull Probability Plot
y1label Sorted Data
x1label Percentiles for Fitted Weibull Distribution
character circle
character hw 1 0.75
character fill on
line blank
.
. Step 3: Generate probability plot
.
weibull probability plot y
.
let gamma = round(gamma,2)
move 20 85
text Gamma = ^gamma
let ppscale = round(ppscale,2)
move 20 82
text Scale = ^ppscale
let ppcc = round(ppcc,3)
move 20 79
text PPCC = ^ppcc
|
Privacy
Policy/Security Notice
Disclaimer |
FOIA
NIST is an agency of the U.S.
Commerce Department.
Date created: 06/10/2016
Last updated: 06/30/2025
Please email comments on this WWW page to
[email protected].
|
|
