
|
|
STRIP PLOTName:
Verticalal axis = all values are set to 1. That is, a strip plot is simply a plot of the sorted response values along one axis. The strip plot is an alternative to a histogram or a density plot. It is typically used for small data sets (histograms and density plots are typically preferred for larger data sets). There are a few variations supported for the strip plot.
where <y> is the response variable; and where the <SUBSET/EXCEPT/FOR qualification is optional. This syntax is used when you have raw data with a single group.
where <y> is the variable of pre-computed frequencies; <x> is the variable containing the class mid-points; and where the <SUBSET/EXCEPT/FOR qualification is optional. This syntax is used when you have binned data with a single group.
where <y> is the response variable; <tag> is a group-id variable; and where the <SUBSET/EXCEPT/FOR qualification is optional. This syntax is used when you have raw data with multiple groups. The word BATCH is required here to distinguish the multiple groups case from the binned data case.
<SUBSET/EXCEPT/FOR qualification> where <y> is the variable of pre-computed frequencies; <x> is the variable containing the class mid-points; <tag> is a group-id variable; and where the <SUBSET/EXCEPT/FOR qualification is optional. This syntax is used when you have binned data with multiple groups. In this case, the word BATCH is optional.
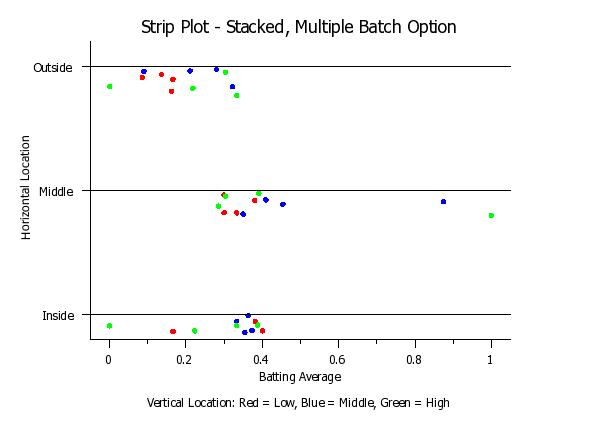
<SUBSET/EXCEPT/FOR qualification> where <y> is the response variable; <tag1> is a group-id variable; <tag2> is a group-id variable; and where the <SUBSET/EXCEPT/FOR qualification is optional. This syntax is used when you have raw data with two group-id variables. The first group-id variable works as in Syntax 3. That is, it defines the position on the y-axis. The second group-id variable is used to identify multiple curves within the first group-id variable. Appropriate settings for the the CHARACTER command and its various attribute setting commands can be used to highlight the different sub-groups within a group. This option is demonstrated with the Program 4 example below.
STRIP PLOT Y SUBSET Y > 2 STRIP PLOT Y X
This is demonstrated in the sample programs below.
Unwin, Theus, and Hofmann (2006), "Graphics of Large Datasets: Visualizing a Million", Springer, p. 36.
10/2009: Added support for a "BATCH MULTIPLE" option
.
.  Step 1: Read the data
.
skip 25
read E2489A.DAT labid y
.
title case asis
title offset 2
label
x2frame off
y2frame off
char circle all
char hw 1 0.75 all
char fill on all
line blank all
tic offset units data
tic offset 0 0
xtic offset 0.2 0.2
.
set strip plot increment 0.1
set strip plot style stack
.
multiplot corner coordiantes 5 5 95 95
multiplot scale factor 2 1
multiplot 2 1
.
.  Step 2a: Generate the strip plot for unbinned data
.           (with one group) Stack Option
.
ylimits 0 2
y1tic marks off
y1tic mark labels off
y1frame off
title Strip Plot - Stacked, Single Group
y1label Number of Occurrences
x1label Data Values
label case asis
strip plot y
.
.  Step 2b: Generate the strip plot for unbinned data
.           (with one group) Jitter Option
.
set strip plot style jitter
.
title Strip Plot - Jittered, Single Group
x1label Data Values
strip plot y
.
end of multiplot
Program 2:
.
.  Step 1: Read the data
.
skip 25
read gear.dat y x
.
title case asis
title offset 2
label
x2frame off
y2frame off
char circle all
char hw 1 0.75 all
char fill on all
line blank all
.
set strip plot increment 0.15
set strip plot style stack
.
ylimits 1 10
major ytic mark number 10
minor ytic mark number 0
y1tic mark offset 1 1
tic offset unit data
ygrid on
title Strip Plot - Stacked, Multiple Groups
y1label Batch Number
x1label Data Values
label case asis
xlimits 0.98 1.02
major xtic mark number 5
minor xtic mark number 1
xtic mark offset 0.002 0.002
.
batch strip plot y x
Program 3:
.
.  Step 1: Read the data
.
skip 25
read E2489A.DAT labid y
.
.  Step 2: Bin the data
.
class lower 0.0
class upper 5.0
class width 0.1
let y2 x2 = binned y
.
.  Step 3: Define the appearance of the plot
.
title case asis
title offset 2
label
x2frame off
y2frame off
char circle all
char hw 1 0.75 all
char fill on all
line blank all
tic offset units data
tic offset 0 0
xtic offset 0.2 0.2
.
ylimits 0.8 2
y1tic marks off
y1tic mark labels off
y1frame off
title Strip Plot - Single Group with Binned Data
y1label Number of Occurrences
x1label Data Values
label case asis
.
.  Step 4: Generate the strip plot
.
frame corner coordinate 15 35 85 70
set strip plot increment 0.1
set strip plot style stack
strip plot y2 x2
Program 3:
.  Step 1: Read the data
.
skip 25
read ripken.dat y x1 x2
.
.  Step 2: Set Plot Options
.
title case asis
title offset 2
label
x2frame off
y2frame off
char circle all
char hw 1 0.75 all
char fill on all
char color red blue green red blue green red blue green
line blank all
.
tic offset unit data
ylimits 1 3
major ytic mark number 3
minor ytic mark number 0
y1tic mark label format alpha
y1tic mark label content Inside Middle Outside
y1label Horizontal Location
y1tic mark offset 0.2  0.2
ygrid on
grid pattern dotted
x1label Batting Average
label case asis
tic mark label case asis
xlimits 0 1
major xtic mark number 6
minor xtic mark number 1
xtic mark offset 0.05 0.05
x3label Vertical Location: Red = Low, Blue = Middle, Green = High
.
.  Step 3: Generate the Strip Plot
.
set strip plot increment 0.1
. set strip plot style stack
set strip plot style jitter
title Strip Plot - Stacked, Multiple Batch Option
batch multiple strip plot y x1 x2
Date created: 12/08/2008 |
Last updated: 12/04/2023 Please email comments on this WWW page to [email protected]. | ||||||||||||||||||||