SED navigation bar go to SED home page go to Dataplot home page go to NIST home page SED Home Page SED Staff SED Projects SED Products and Publications Search SED Pages
Dataplot Vol 1 Vol 2

FREQUENCY PLOT

Name:
    ... FREQUENCY PLOT
Type:
    Graphics Command
Purpose:
    Generates a frequency plot.
Description:
    A frequency plot is a graphical data analysis technique for summarizing the distributional information of a variable. The response variable is divided into equal sized intervals (or bins). The number of occurrences of the response variable is calculated for each bin. The frequency plot then consists of:

      Vertical axis = frequencies or relative frequencies;
      Horizontal axis = response variable (i.e., the mid-point of each interval).

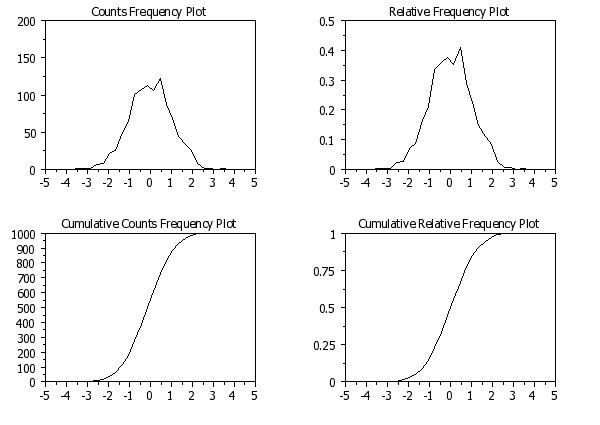
    There are 4 types of frequency plots:

    1. frequency plot (absolute counts);
    2. relative frequency plot (converts counts to proportions);
    3. cumulative frequency plot;
    4. cumulative relative frequency plot.

    The frequency plot and the histogram have the same information except the frequency plot has lines connecting the frequency values whereas the histogram has bars at the frequency values.

Syntax 1:
    <type> <y>             <SUBSET/EXCEPT/FOR qualification>
    where <type> is one of FREQUENCY, RELATIVE FREQUENCY, CUMULATIVE FREQUENCY, CUMULATIVE RELATIVE FREQUENCY;
                <y> is the variable of raw data values which will appear on the horizontal axis;
    and where the <SUBSET/EXCEPT/FOR qualification> is optional.

    This syntax is used when you have raw data. Note that <y> can be either a variable or a matrix. If <y> is a matrix, then a frequency plot will be generated for all values in that matrix.

Syntax 2:
    <type> <y> <x>             <SUBSET/EXCEPT/FOR qualification>
    where <type> is one of FREQUENCY, RELATIVE FREQUENCY, CUMULATIVE FREQUENCY, CUMULATIVE RELATIVE FREQUENCY;
                <y> is a variable containing pre-computed frequencies;             <x> is a variable containing the bin mid-points;
    and where the <SUBSET/EXCEPT/FOR qualification is optional.

    This syntax is used when you have grouped data with equi-sized bins.

Syntax 3:
    <type> <y> <xlow> <xhigh>             <SUBSET/EXCEPT/FOR qualification>
    where <type> is one of FREQUENCY, RELATIVE FREQUENCY, CUMULATIVE FREQUENCY, CUMULATIVE RELATIVE FREQUENCY;
                <y> is a variable containing pre-computed frequencies;
                <xlow> is a variable containing the lower limits for the bins;
                <xhigh> is a variable containing the upper limits for the bins;
    and where the <SUBSET/EXCEPT/FOR qualification is optional.

    This syntax is used when you have grouped data with unequal sized bins.

Syntax 4:
    MULTIPLE <type> <y1> ... <yk>             <SUBSET/EXCEPT/FOR qualification>
    where <type> is one of FREQUENCY, RELATIVE FREQUENCY, CUMULATIVE FREQUENCY, CUMULATIVE RELATIVE FREQUENCY;
                <y1> ... <yk> is a list of response variables;
    and where the <SUBSET/EXCEPT/FOR qualification> is optional.

    This syntax will overlay multiple frequency plots on the same plot.

    Note that the response variables (<y1> ... <yk> can be either variables or matrices (or a mix of variables and matrices). For matrices, a frequency plot will be generated for all values in the matrix.

Syntax 5:
    REPLICATED <type> <y> <x1>             <SUBSET/EXCEPT/FOR qualification>
    where <type> is one of FREQUENCY, RELATIVE FREQUENCY, CUMULATIVE FREQUENCY, CUMULATIVE RELATIVE FREQUENCY;
                <y> is the response variable;
                <x1> is a group-id variable;
    and where the <SUBSET/EXCEPT/FOR qualification> is optional.

    This syntax will generate a frequency plot for each distinct value in the group-id variable. The frequency plots will be generated on the same page.

Syntax 6:
    REPLICATED <type> <y> <x1> <x2>             <SUBSET/EXCEPT/FOR qualification>
    where <type> is one of FREQUENCY, RELATIVE FREQUENCY, CUMULATIVE FREQUENCY, CUMULATIVE RELATIVE FREQUENCY;
                <y> is the response variable;
                <x1> is the first group-id variable;
                <x2> is the second group-id variable;
    and where the <SUBSET/EXCEPT/FOR qualification> is optional.

    This syntax will cross tabulate the group-id variables and generate a frequency plot for each unique combination of values for the <x1> and <x2> group-id variables. The frequency plots will be generated on the same page.

Examples:
    FREQUENCY PLOT TEMP
    RELATIVE FREQUENCY PLOT TEMP
    CUMULATIVE FREQUENCY PLOT TEMP
    CUMULATIVE RELATIVE FREQUENCY PLOT TEMP
    FREQUENCY PLOT COUNTS STATE
    RELATIVE FREQUENCY PLOT COUNTS STATE
    CUMULATIVE FREQUENCY PLOT COUNTS STATE
    CUMULATIVE RELATIVE FREQUENCY PLOT COUNTS STATE
Note:
    Although DATAPLOT does not have a FREQUENCY TABLE command, one can be generated with the following commands:

      FREQUENCY PLOT Y
      LET YFREQ = YPLOT
      LET XVAL = XPLOT

    Then the variables YFREQ and XVAL essentially contain a frequency table. There is a LET subcommand called FREQUENCY. However, it does not generate a frequency table in the sense that a frequency plot does. You can also use the command

      LET Y2 X2 = BINNED Y

    for this purpose.

Note:
    By default, Dataplot uses a class width of 0.3 X the standard deviation of the variable. Use the CLASS WIDTH command to override this default. Dataplot also tends to generate a large number of zero frequency classes at the lower and upper tails. This tends to compress the frequency plot on the horizontal axis. Use the XLIMITS command or the CLASS LOWER and CLASS UPPER commands to avoid plotting these zero frequency classes.

    A number of alternative choices for class width can be set with the command

      HISTOGRAM CLASS WIDTH

    Enter HELP HISTOGRAM CLASS WIDTH for details.

Note:
    By default, Dataplot sets the lower and upper class limits to xbar -/+ 6*s (with xbar and s denoting the sample mean and standard deviation, respectively). This can occassionally result in a few outlying points being excluded from the frequency plot. To adjust the lower and upper class limits so that these outlying points are included, enter the command

      SET HISTOGRAM OUTLIERS ON

    To revert to the default, enter

      SET HISTOGRAM OUTLIERS OFF
Note:
    The FREQUENCY PLOT supports the TO syntax for the list of variable names. This is most useful for the MULTIPLE case.
Default:
    None
Synonyms:
    A synonym for CUMULATIVE RELATIVE FREQUENCY PLOT is RELATIVE CUMULATIVE FREQUENCY PLOT.
Related Commands:
    HISTOGRAM = Generates a histogram.
    KERNEL DENSITY PLOT = Generate a kernel density plot.
    PERCENT POINT PLOT = Generate a percent point plot.
    PROBABILITY PLOT = Generate a probability plot.
    PPCC PLOT = Generates probability plot correlation coefficient plot.
    PLOT = Generate a data or function plot.
    CLASS LOWER = Set the lower class minimum for histograms, frequency plots, and pie charts.
    CLASS UPPER = Set the upper class maximum for histograms, frequency plots, and pie charts.
    CLASS WIDTH = Set the class width for histograms, frequency plots, and pie charts.
    HISTOGRAM CLASS WIDTH = Specify alternative default class wdith algorithms for histograms.
    MINIMUM = Set the frame minima for all plots.
    MAXIMUM = Set the frame maxima for all plots.
    LIMITS = Set the frame limits for all plots.
    BARS = Set the on/off switches for plot bars.
    BAR WIDTH = Set the widths for plot bars.
    BAR FILL = Set the on/off switches for plot bar fills.
    BAR PATTERN = Set the types for bar fill patterns.
    BAR BORDER LINE = Set the types for bar border lines.
Reference:
    Most introductory statistics book discuss frequency polygons and histograms.

    David Scott (1992), "Multivariate Density Estimation", John Wiley, (chapter 3).

Applications:
    Exploratory Data Analysis, Distributional Analysis
Implementation Date:
    Pre-1987
Program:
     
    LET Y = NORMAL RANDOM NUMBERS FOR I = 1 1 1000
    MULTIPLOT 2 2
    MULTIPLOT CORNER COORDINATES 0 0 100 100
    MULTIPLOT SCALE FACTOR 2
    TITLE CASE ASIS
    TITLE OFFSET 2
    .
    XLIMITS -5 5
    TITLE Counts Frequency Plot
    FREQUENCY PLOT Y
    TITLE Relative Frequency Plot
    RELATIVE FREQUENCY PLOT Y
    TITLE Cumulative Counts Frequency Plot
    CUMULATIVE FREQUENCY PLOT Y
    TITLE Cumulative Relative Frequency Plot
    CUMULATIVE RELATIVE FREQUENCY PLOT Y
    END OF MULTIPLOT
        

    plot generated by sample program

Date created: 11/30/2010
Last updated: 12/04/2023

Please email comments on this WWW page to alan.heckert@nist.gov.