SED navigation bar go to SED home page go to Dataplot home page go to NIST home page SED Home Page SED Staff SED Projects SED Products and Publications Search SED Pages
Dataplot Vol 1 Vol 2

HISTOGRAM CLASS WIDTH (SET)

Name:
    HISTOGRAM CLASS WIDTH
Type:
    Set Command
Purpose:
    Specifies the default class width algorithm to use in subsequent histogram and average shifted histograms.
Description:
    One use for the histogram is to suggest an appropriate distributional model for a data set. However, the optimal class width (optimal in this sense is defined as the integrated mean square error between the histogram and an overlaid probability density function for the given distribution) for a histogram depends on what the underlying distribution of the data is. For this reason, there is no one single algorithm that will generate an optimal class width for a histogram.

    A number of researchers, David Scott in particular, have investigated the issue of optimal class widths for histograms. This command allows you to select among several different default algorithms for the class width of the histogram.

    The available choices are:

    • DEFAULT - uses the Dataplot default of 0.3 times the sample standard deviation

    • NORMAL - David Scott's optimal class width for the case when the data are in fact normal. The class width is

        3.5s/n(1/3)

      where s and n are the sample standard deviation and sample size, respectively.

    • NORMAL CORRECTED - David Scott's recommendation for adjusting the "NORMAL" class width to account for sample skewness and sample kurtosis. The adjusted formula is

        3.5s/n(1/3) *SF*KF

      where SF and KF are the skewness and kurtosis factors, respectively

        SF = 1/(1 - 0.0060*skew + 0.27*skew2 - 0.0069*skew3)

        KF = 1 - 0.2 (1 - e-0.7*kurt)

      with skew and kurt denoting the sample skewness and sample kurtosis - 3 (the -3 adjusts the kurtosis so that a normal distribution has a kurtosis of 0).

      The SF factor is only applied if the sample skewness is between 0 and 3. The KF factor is only applied if the sample kurtosis -3 is between 0 and 6.

    • IQ RANGE - David Scott's recommendation for a relatively robust class width algorithm based on the sample interquartile range (robust in this sense means relatively good performance across a wide range of underlying distributions). The class width in this case is

        2.603*IQ/(n(1/3)

      with IQ and n denoting the sample interquartile range and sample size, respectively.

    Note that you can also use the CLASS WIDTH command to set an explicit width (a CLASS WIDTH command will override a SET HISTOGRAM CLASS WIDTH command).

Syntax:
    SET HISTOGRAM CLASS WIDTH <type>
    where <type> is one of DEFAULT, NORMAL, NORMAL CORRECTED, or IQ RANGE.
Examples:
    SET HISTOGRAM CLASS WIDTH DEFAULT
    SET HISTOGRAM CLASS WIDTH NORMAL
    SET HISTOGRAM CLASS WIDTH IQ RANGE
Default:
    The default histogram class width is 0.3 times the sample standard deviation.
Synonyms:
    INTERQUARTILE RANGE and IQ are synonyms for IQ RANGE.
Related Commands:
    CLASS LOWER = Sets the lower class maximum for histograms, frequency plots, and pie charts.
    CLASS UPPER = Sets the upper class maximum for histograms, frequency plots, and pie charts.
    CLASS WIDTH = Sets the class width for histograms, frequency plots, and pie charts.
    HISTOGRAM = Generate a histogram.
    ASH = Generate an average shifted histogram.
Reference:
    David Scott (1992), "Multivariate Density Estimation," John Wiley.
Applications:
    Distributional Plots
Implementation Date:
    2004/9
Program 1:
     
    TITLE OFFSET 2
    YLIMITS 0 0.5
    XLIMITS -5 5
    XTIC OFFSET 2 2
    LET Y = DOUBLE EXPONENTIAL RANDOM NUMBERS FOR I = 1 1 1000
    MULTIPLOT CORNER COORDINATES 0 0 100 95
    MULTIPLOT 2 2
    TITLE DEFAULT (0.3*S)
    RELATIVE HISTOGRAM Y
    MULTIPLOT 2 2 1
    PLOT DEXPDF(X) FOR X = -5  0.01  5
    SET HISTOGRAM CLASS WIDTH NORMAL
    TITLE NORMAL
    MULTIPLOT 2 2 2
    RELATIVE HISTOGRAM Y
    MULTIPLOT 2 2 2
    PLOT DEXPDF(X) FOR X = -5  0.01  5
    SET HISTOGRAM CLASS WIDTH NORMAL CORRECTED
    TITLE NORMAL CORRECTED
    MULTIPLOT 2 2 3
    RELATIVE HISTOGRAM Y
    MULTIPLOT 2 2 3
    PLOT DEXPDF(X) FOR X = -5  0.01  5
    SET HISTOGRAM CLASS WIDTH IQ RANGE
    TITLE IQ RANGE
    MULTIPLOT 2 2 4
    RELATIVE HISTOGRAM Y
    MULTIPLOT 2 2 4
    PLOT DEXPDF(X) FOR X = -5  0.01  5
    END OF MULTIPLOT
    MOVE 50 97
    JUSTIFICATION CENTER
    TEXT DIFFERENT HISTOGRAM CLASS WIDTHS - DOUBLE EXPONENTIAL DATA
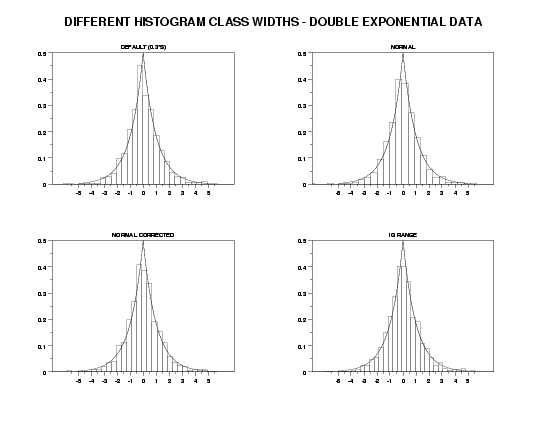
        
    plot generated by sample program

Program 2:
     
    TITLE OFFSET 2
    YLIMITS 0 1
    XLIMITS 0 4
    XTIC OFFSET 0.2 0
    LET GAMMA = 1.5
    LET Y = WEIBULL RANDOM NUMBERS FOR I = 1 1 100
    MULTIPLOT CORNER COORDINATES 0 0 100 95
    MULTIPLOT 2 2
    TITLE DEFAULT (0.3*S)
    RELATIVE HISTOGRAM Y
    MULTIPLOT 2 2 1
    PLOT WEIPDF(X,GAMMA) FOR X = 0  0.01  5
    SET HISTOGRAM CLASS WIDTH NORMAL
    TITLE NORMAL
    MULTIPLOT 2 2 2
    RELATIVE HISTOGRAM Y
    MULTIPLOT 2 2 2
    PLOT WEIPDF(X,GAMMA) FOR X = 0  0.01  5
    SET HISTOGRAM CLASS WIDTH NORMAL CORRECTED
    TITLE NORMAL CORRECTED
    MULTIPLOT 2 2 3
    RELATIVE HISTOGRAM Y
    MULTIPLOT 2 2 3
    PLOT WEIPDF(X,GAMMA) FOR X = 0  0.01  5
    SET HISTOGRAM CLASS WIDTH IQ RANGE
    TITLE IQ RANGE
    MULTIPLOT 2 2 4
    RELATIVE HISTOGRAM Y
    MULTIPLOT 2 2 4
    PLOT WEIPDF(X,GAMMA) FOR X = 0  0.01  5
    END OF MULTIPLOT
    MOVE 50 97
    JUSTIFICATION CENTER
    TEXT DIFFERENT HISTOGRAM CLASS WIDTHS - WEIBULL DATA
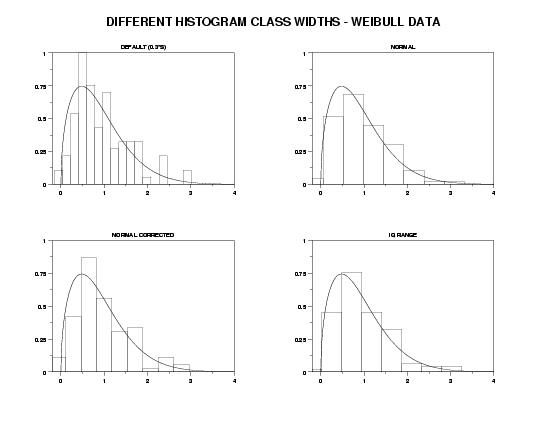
        
    plot generated by sample program

Privacy Policy/Security Notice
Disclaimer | FOIA

NIST is an agency of the U.S. Commerce Department.

Date created: 12/5/2005
Last updated: 10/30/2015

Please email comments on this WWW page to alan.heckert@nist.gov.