
|
|
GOODNESS OF FITName:
Detailed descriptions of each of these methods is given below in the Notes section. As a general comment, goodness of fit methods are typically based on comparing the cumulative distribution of the data with a theoretical distribution or comparing the quantiles of the data with the a theoretical percent point function. Previous versions of Dataplot supported separate commands (ANDERSON DARLING TEST, KOLMOGOROV SMIRNOV GOODNESS OF FIT TEST, and CHI-SQUARE GOODNESS OF FIT TEST). These separate commands have been replaced with the unified GOODNESS OF FIT command and are no longer available). Some comments on this command.
<SUBSET/EXCEPT/FOR qualification> where <dist> is one Dataplot's supported distributions; <method> is one of ANDERSON DARLING, KOLMOGOROV SMIRNOV, CHI-SQUARE, or PPCC; <y> is the response variable; and where the <SUBSET/EXCEPT/FOR qualification> is optional. Enter HELP PROBABILITY DISTRIBUTIONS for a list of supported distributions and the name of any required parameters.
<SUBSET/EXCEPT/FOR qualification> where <dist> is one Dataplot's supported distributions; <method> is one of ANDERSON DARLING, KOLMOGOROV SMIRNOV, CHI-SQUARE, or PPCC; <y1> ... <yk> is a list of 1 to 30 response variables; and where the <SUBSET/EXCEPT/FOR qualification> is optional. This syntax will generate the goodness of fit statistic for each variable in the list. Note that the syntax
is supported. This is equivalent to
<SUBSET/EXCEPT/FOR qualification> where <dist> is one Dataplot's supported distributions; <method> is one of ANDERSON DARLING, KOLMOGOROV SMIRNOV, CHI-SQUARE, or PPCC; <y> is the response variable; <x1> ... <xk> is a list of 1 to 6 group-id variables; and where the <SUBSET/EXCEPT/FOR qualification> is optional.
This syntax peforms a cross-tabulation of
Note that the syntax
<SUBSET/EXCEPT/FOR qualification> where <dist> is one Dataplot's supported distributions; <y> is a variable of pre-computed frequencies; <x> is a variable containing the mid-points of the bins; and where the <SUBSET/EXCEPT/FOR qualification> is optional. This syntax is used for the case where you have binned data with equal size bins. Currently, only the chi-square goodness of fit method is supported for grouped data (although this may change in future releases).
<SUBSET/EXCEPT/FOR qualification> where <dist> is one Dataplot's supported distributions; <y> is a variable of pre-computed frequencies; <xlow> is a variable containing the lower limits of the bins; <xhigh> is a variable containing the upper limits of the bins; and where the <SUBSET/EXCEPT/FOR qualification> is optional. This syntax is used for the case where you have binned data with unequal size bins. Currently, only the chi-square goodness of fit method is supported for grouped data (although this may change in future releases).
LET KSLOC = 5 LET KSSCALE = 10 WEIBULL ANDERSON DARLING GOODNESS OF FIT Y WEIBULL KOLMOGOROV SMIRNOV GOODNESS OF FIT Y WEIBULL PPCC GOODNESS OF FIT Y WEIBULL CHI-SQUARE GOODNESS OF FIT Y
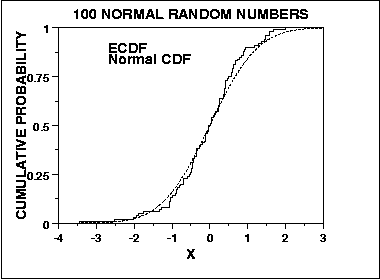
where ni is the number of points less than Yi This is a step function that increases by 1/N at the value of each data point. The Kolmogorov-Smirnov goodness of fit test statistic is defined as
where F is the theoretical cumulative distribution of the distribution being tested. We can graph a plot of the empirical distribution function with a cumulative distribution function for a given distribution. The K-S test is based on the maximum distance between these two curves. An example of this plot for a sample of 100 normal random numbers is given here.
An attractive feature of this test is that the distribution of the K-S test statistic itself does not depend on the underlying cumulative distribution function being tested. Another advantage is that it is an exact test (the chi-square goodness of fit depends on an adequate sample size for the approximations to be valid). Despite these advantages, the K-S test has several important limitations:
To specify whether published tables or simulation will be used to generate the critical values, enter the command (if the specified distribution does not support published tables, simulation will automatically be used).
Currently, Dataplot supports critical values from published tables for the following distributions:
Dynamic simulation of critical values for other distributions is available when there is a built-in maximum likelihood estimation procedure available (see the Note section below for the SET DISTRIBUTIONAL FIT TYPE command for a complete list of supported distributions). Note that the uniform (0,1) case can be used for fully specified distributions (i.e., the shape, location, and scale parameters are not estimated from the data). Simply apply the appropriate CDF function to the data (this transforms it to a (0,1) interval) and apply the uniform (0,1) test to the transformed data. The Anderson-Darling test statistic is
where
where F is the cumulative distribution function of interest.
For the chi-square goodness of fit, the data is divided into k bins and the test statistic is defined as
where Oi is the observed frequency for bin i and Ei is the expected frequency for bin i. The expected frequency is calculated by
where F is the cumulative distribution function for the distribution being tested, Yu is the upper limit for class i, and Yl is the lower limit for class i. This test is sensitive to the choice of bins. There is no optimal choice for the bin width (since the optimal bin width depends on the distribution). Most reasonable choices should produce similar, but not identical, results. This test is most frequently used when the data are received in pre-binned form (for raw data, the Anderson-Darling test is more powerful). However, you can use the chi-square test for raw data (you typically will want to have a reasonably large data set before doing this). For raw data, you can specify the binning with the commands CLASS WIDTH, CLASS LOWER, and CLASS UPPER. The default class width is 0.3 times the sample standard deviation. To specify other default algorithms, enter HELP HISTOGRAM CLASS WIDTH. For the chi-square approximation to be valid, the expected frequency should be at least 5. The chi-square approximation may not be valid for small samples, and if some of the counts are less than five, you may need to combine some bins in the tails. The test statistic follows, approximately, a chi-square distribution with (k - c) degrees of freedom where k is the number of non-empty cells and c = the number of parameters (including location and scale parameters and shape parameters) for the distribution + 1. For example, for a 3-parameter Weibull distribution, c = 4. The primary advantage of the chi square goodnes of fit test is that it is quite general. It can be applied for any distribution, either discrete or continuous, for which the cumulative distribution function can be computed. Dataplot supports the chi-square goodness of fit test for all distributions for which it supports a CDF function. There are several disadvantages:
For more information on the PPCC method, enter HELP PPCC PLOT. Also see the NIST/SEMATACH e-Handbook of Statistical Methods:
For several distributions, you can choose an alternative estimation method using the command
where <value> can be one of the following (since this applies to the Anderson-Darling or Kolmogorov-Smirnov methods, only continuous distributions are listed).
Note that the above list gives the distributions for which dynamic critical values can be obtained by simulation when the parameters are assumed unknown for the Anderson-Darling and Kolmogorov-Smirnov methods. If a particular distribution only supports a single method (e.g., several currently only support L-moment estimates), that method will always be used. If you specify a method that is not supported for a given distribution, the default method (usually maximum likelihood) will be used. Also note that a given estimation method for a particular distribution may fail for certain data sets. Since a large number of simulated data sets are generated, this may be an issue for some distributions. The output will return the number of times a failure in the estimation procedure was detected in the simulations.
GOF is a synonym for GOODNESS OF FIT
Stephens, M. A. (1976), "Asymptotic Results for Goodness-of-Fit Statistics with Unknown Parameters," Annals of Statistics, Vol. 4, pp. 357-369. Stephens, M. A. (1977), "Goodness of Fit for the Extreme Value Distribution," Biometrika, Vol. 64, pp. 583-588. Stephens, M. A. (1977), "Goodness of Fit with Special Reference to Tests for Exponentiality," Technical Report No. 262, Department of Statistics, Stanford University, Stanford, CA. Stephens, M. A. (1979), "Tests of Fit for the Logistic Distribution Based on the Empirical Distribution Function," Biometrika, Vol. 66, pp. 591-595. "MIL-HDBK-17 Volume 1: Guidelines for Characterization of Structural Materials", Depeartment of Defense, chapter 8. The URL for MIL-HDBK-17 is http://mil-17.udel.edu/. V. Choulakian and M. A. Stephens (2001), "Goodness-of-Fit Tests for the Generalized Pareto Distribution", Technometrics, Vol. 43, No. 4, pp. 478-484. James J. Filliben (1975), "The Probability Plot Correlation Coefficient Test for Normality," Technometrics, Vol. 17, No. 1. Chakravart, Laha, and Roy (1967), "Handbook of Methods of Applied Statistics, Volume I," John Wiley, pp. 392-394. Snedecor and Cochran (1989), "Statistical Methods", Eight Edition, Iowa State, 1989, pp. 76-79.
.  Step 1: Read the data
.
.          Following data from Jeffery Fong of the NIST
.          Applied and Computational Mathematics Division.
.          This is strength data in ksi units.
.
read y
18.830
20.800
21.657
23.030
23.230
24.050
24.321
25.500
25.520
25.800
26.690
26.770
26.780
27.050
27.670
29.900
31.110
33.200
33.730
33.760
33.890
34.760
35.750
35.910
36.980
37.080
37.090
39.580
44.045
45.290
45.381
end of data
.
.  Step 2: Apply goodness of fit tests for Weibull distribution
.          based on ML estimates
.
set write decimals 5
3-parameter weibull mle y
let ksloc = locml
let ksscale = scaleml
let gamma = shapeml
.
.          Anderson-Darling
.
set anderson darling critical values table
weibull anderson darling goodness of fit y
set anderson darling critical values simulation
weibull anderson darling goodness of fit y
.
.  Step 3: Apply goodness of fit tests for normal distribution
.
normal mle y
let ksloc = xmean
let ksscale = xsd
.
set anderson darling critical values table
normal anderson darling goodness of fit y
set anderson darling critical values simulation
normal anderson darling goodness of fit y
set kolmogorov smirnov critical values simulation
normal kolmogorov smirnov goodness of fit y
The following output is generated.
*********************************
** 3-parameter weibull mle y **
*********************************
Three-Parameter Weibull (Minimum) Parameter Estimation:
Full Sample Case
Summary Statistics:
Number of Observations: 31
Sample Mean: 30.81141
Sample Standard Deviation: 7.25338
Sample Skewness: 0.39880
Sample Minimum: 18.82999
Sample Maximum: 45.38100
Zanakis Percentile Method:
Estimate of Location: 18.65836
Estimate of Scale: 15.10163
Estimate of Shape: 1.86735
Value of Log-Likelihood Function: -104.60286
AIC: 215.20572
AICC: 216.09461
BIC: 219.50768
Wycoff-Bain-Englehardt Percentile Method
Estimate of Location: 16.64362
Estimate of Scale: 16.41275
Estimate of Shape: 1.92760
Value of Log-Likelihood Function: -103.63967
AIC: 213.27934
AICC: 214.16823
BIC: 217.58131
Modified Moments:
Estimate of Location: 15.60378
Estimate of Scale: 17.17121
Estimate of Shape (Gamma): 2.21477
Standard Error of Location: 0.71154
Standard Error of Scale: 0.52547
Standard Error of Shape: 0.09924
Value of Log-Likelihood Function: -103.56460
AIC: 213.12921
AICC: 214.01810
BIC: 217.43118
Maximum Likelihood:
Estimate of Location: 17.64420
Estimate of Scale: 14.83507
Estimate of Shape (Gamma): 1.91358
Value of Log-Likelihood Function: -103.26267
AIC: 212.52535
AICC: 213.41423
BIC: 216.82731
*************************
** let ksloc = locml **
*************************
THE COMPUTED VALUE OF THE CONSTANT KSLOC = 0.1764420E+02
*****************************
** let ksscale = scaleml **
*****************************
THE COMPUTED VALUE OF THE CONSTANT KSSCALE = 0.1483507E+02
***************************
** let gamma = shapeml **
***************************
THE COMPUTED VALUE OF THE CONSTANT GAMMA = 0.1913580E+01
***********************************
** . Anderson-Darling **
***********************************
**************************************************
** set anderson darling critical values table **
**************************************************
THE FORTRAN COMMON CHARACTER VARIABLE ANDEDARL HAS JUST BEEN SET TO TABL
**************************************************
** weibull anderson darling goodness of fit y **
**************************************************
Anderson-Darling Goodness of Fit Test
(Critical Values from Published Tables)
Response Variable: Y
H0: The distribution fits the data
Ha: The distribution does not fit the data
Distribution: WEIBULL
Location Parameter: 17.64420
Scale Parameter: 14.83507
Shape Parameter 1: 1.91358
Summary Statistics:
Number of Observations: 31
Sample Minimum: 18.82999
Sample Maximum: 45.38100
Sample Mean: 30.81141
Sample SD: 7.25338
Anderson-Darling Test Statistic Value: 0.33805
Adjusted Test Statistic Value: 0.35019
Conclusions (Upper 1-Tailed Test)
----------------------------------------------
Alpha CDF Critical Value Conclusion
----------------------------------------------
10% 90% 0.637 Accept H0
5% 95% 0.757 Accept H0
2.5% 97.5% 0.877 Accept H0
1% 99% 1.038 Accept H0
*******************************************************
** set anderson darling critical values simulation **
*******************************************************
THE FORTRAN COMMON CHARACTER VARIABLE ANDEDARL HAS JUST BEEN SET TO SIMU
**************************************************
** weibull anderson darling goodness of fit y **
**************************************************
Anderson-Darling Goodness of Fit Test
(Fully Specified Model)
Response Variable: Y
H0: The distribution fits the data
Ha: The distribution does not fit the data
Distribution: WEIBULL
Location Parameter: 17.64420
Scale Parameter: 14.83507
Shape Parameter 1: 1.91358
Summary Statistics:
Number of Observations: 31
Sample Minimum: 18.82999
Sample Maximum: 45.38100
Sample Mean: 30.81141
Sample SD: 7.25338
Anderson-Darling Test Statistic Value: 0.33805
Number of Monte Carlo Simulations: 10000.00000
CDF Value: 0.09370
P-Value 0.90630
Percent Points of the Reference Distribution
-----------------------------------
Percent Point Value
-----------------------------------
0.0 = 0.000
50.0 = 0.772
75.0 = 1.248
90.0 = 1.964
95.0 = 2.579
97.5 = 3.230
99.0 = 4.115
99.5 = 4.814
Conclusions (Upper 1-Tailed Test)
----------------------------------------------
Alpha CDF Critical Value Conclusion
----------------------------------------------
10% 90% 1.964 Accept H0
5% 95% 2.579 Accept H0
2.5% 97.5% 3.230 Accept H0
1% 99% 4.115 Accept H0
*Critical Values Based on 10000 Monte Carlo Simulations
********************
** normal mle y **
********************
Normal Parameter Estimation
Summary Statistics:
Number of Observations: 31
Sample Minimum: 18.82999
Sample Maximum: 45.38100
Maximum Likelihood:
Estimate of Location (Mean): 30.81141
Standard Error of Location: 1.30274
Estimate of Scale (SD): 7.25338
Standard Error of Scale: 0.93640
Log-likelihood: -0.1049126E+03
AIC: 0.2138252E+03
AICc: 0.2142538E+03
BIC: 0.2166932E+03
Confidence Interval for Location Parameter (Normal Approximation)
---------------------------------------------
Confidence Lower Upper
Coefficient Limit Limit
---------------------------------------------
50.00 29.92196 31.70087
75.00 29.28321 32.33962
90.00 28.60032 33.02251
95.00 28.15085 33.47198
99.00 27.22887 34.39396
99.90 26.06166 35.56117
---------------------------------------------
Confidence Interval for Scale Parameter (Normal Approximation)
---------------------------------------------
Confidence Lower Upper
Coefficient Limit Limit
---------------------------------------------
50.00 6.73462 8.03002
75.00 6.35897 8.58825
90.00 6.00479 9.23849
95.00 5.79626 9.69540
99.00 5.42284 10.69967
99.90 5.03893 12.08652
---------------------------------------------
*************************
** let ksloc = xmean **
*************************
THE COMPUTED VALUE OF THE CONSTANT KSLOC = 0.3081142E+02
*************************
** let ksscale = xsd **
*************************
THE COMPUTED VALUE OF THE CONSTANT KSSCALE = 0.7253381E+01
**************************************************
** set anderson darling critical values table **
**************************************************
THE FORTRAN COMMON CHARACTER VARIABLE ANDEDARL HAS JUST BEEN SET TO TABL
*************************************************
** normal anderson darling goodness of fit y **
*************************************************
Anderson-Darling Goodness of Fit Test
(Critical Values from Published Tables)
Response Variable: Y
H0: The distribution fits the data
Ha: The distribution does not fit the data
Distribution: NORMAL
Location Parameter: 30.81141
Scale Parameter: 7.25338
Summary Statistics:
Number of Observations: 31
Sample Minimum: 18.82999
Sample Maximum: 45.38100
Sample Mean: 30.81141
Sample SD: 7.25338
Anderson-Darling Test Statistic Value: 0.53219
Adjusted Test Statistic Value: 0.58701
Conclusions (Upper 1-Tailed Test)
----------------------------------------------
Alpha CDF Critical Value Conclusion
----------------------------------------------
10% 90% 0.616 Accept H0
5% 95% 0.735 Accept H0
2.5% 97.5% 0.861 Accept H0
1% 99% 1.020 Accept H0
*******************************************************
** set anderson darling critical values simulation **
*******************************************************
THE FORTRAN COMMON CHARACTER VARIABLE ANDEDARL HAS JUST BEEN SET TO SIMU
*************************************************
** normal anderson darling goodness of fit y **
*************************************************
Anderson-Darling Goodness of Fit Test
(Fully Specified Model)
Response Variable: Y
H0: The distribution fits the data
Ha: The distribution does not fit the data
Distribution: NORMAL
Location Parameter: 30.81141
Scale Parameter: 7.25338
Summary Statistics:
Number of Observations: 31
Sample Minimum: 18.82999
Sample Maximum: 45.38100
Sample Mean: 30.81141
Sample SD: 7.25338
Anderson-Darling Test Statistic Value: 0.53219
Number of Monte Carlo Simulations: 10000.00000
CDF Value: 0.29750
P-Value 0.70250
Percent Points of the Reference Distribution
-----------------------------------
Percent Point Value
-----------------------------------
0.0 = 0.000
50.0 = 0.764
75.0 = 1.231
90.0 = 1.919
95.0 = 2.478
97.5 = 3.115
99.0 = 3.942
99.5 = 4.535
Conclusions (Upper 1-Tailed Test)
----------------------------------------------
Alpha CDF Critical Value Conclusion
----------------------------------------------
10% 90% 1.919 Accept H0
5% 95% 2.478 Accept H0
2.5% 97.5% 3.115 Accept H0
1% 99% 3.942 Accept H0
*Critical Values Based on 10000 Monte Carlo Simulations
*********************************************************
** set kolmogorov smirnov critical values simulation **
*********************************************************
THE FORTRAN COMMON CHARACTER VARIABLE KOLMSMIR HAS JUST BEEN SET TO SIMU
***************************************************
** normal kolmogorov smirnov goodness of fit y **
***************************************************
Kolmogorov-Smirnov Goodness of Fit Test
Response Variable: Y
H0: The distribution fits the data
Ha: The distribution does not fit the data
Distribution: NORMAL
Location Parameter: 30.81141
Scale Parameter: 7.25338
Summary Statistics:
Number of Observations: 31
Sample Minimum: 18.82999
Sample Maximum: 45.38100
Sample Mean: 30.81141
Sample SD: 7.25338
Kolmogorov-Smirnov Test Statistic Value: 0.15139
Number of Monte Carlo Simulations: 10000.00000
CDF Value: 0.57660
P-Value 0.42340
(Fully Specified Model)
Percent Points of the Reference Distribution
-----------------------------------
Percent Point Value
-----------------------------------
0.0 = 0.000
50.0 = 0.143
75.0 = 0.176
90.0 = 0.213
95.0 = 0.236
97.5 = 0.256
99.0 = 0.284
99.5 = 0.305
Conclusions (Upper 1-Tailed Test)
----------------------------------------------
Alpha CDF Critical Value Conclusion
----------------------------------------------
10% 90% 0.213 Accept H0
5% 95% 0.236 Accept H0
1% 99% 0.284 Accept H0
*Critical Values Based on 10000 Monte Carlo Simulations
Date created: 09/22/2011 |
Last updated: 12/04/2023 Please email comments on this WWW page to [email protected]. | ||||||||||||||||||||||||||||||||||||
 ).
).