
|
|
COEFFICIENT OF VARIATION TESTName:
where σ and μ denote the population standard deviation and population mean, respectively. The sample coefficient of variation is defined as
where s and \( \bar{x} \) denote the sample standard deviation and sample mean respectively. The coefficient of variation should typically only be used for ratio data. That is, the data should be continuous and have a meaningful zero. Although the coefficient of variation statistic can be computed for data that is not on a ratio scale, the interpretation of the coeffcient of variation may not be meaningful. Currently, this command is only supported for non-negative data. If the response variable contains one or more negative numbers, an error message will be returned. The one sample coefficient of variation tests whether the coefficient of variation is equal to a given value. Note that this can be for either a single sample or for the common coefficient for multile groups of data (it is assummed the groups have equal population coefficient of variation values).
The test statistic is
where
where γ is the common coefficient of variation and γ0 is the hypothesized value. This statistic is compared to a chi-square with \( \sum_{i}^{k}{n_{i} - 1} \) degrees of freedom. The most common usage is the case for a single group (i.e., k = 1). The two sample coefficient of variation tests whether two distinct samples have equal, but unspecified, coefficients of variations. As with the single sample case, each of the two samples can consist of either a single group or multiple groups of data.
The test statistic is
where
\( \mbox{DENOM} = \frac {\sum_{i}^{k}{(n_{2i} - 1) u_{2i}}} {\sum_{i}^{k}{n_{2i} - 1}} \) where
when k1 = k2 = 1, the test simplifies to
This statistic is compared to the F distribution with \( \sum_{i=1}^{k_{1}}{n_{1i} -1} \) and \( \sum_{i=1}^{k_{2}}{n_{2i} -1} \) degrees of freedom. The test implemented here was proposed by Forkman (see the References below). There are a number of alternative tests (see the paper by Krishnamooorthy and Lee in the References section). Simulations by Forkman and also by Krishnamoorthy and Lee indicate that the Forkman test has good nominal coverage and reasonable power.
<SUBSET/EXCEPT/FOR qualification> where <y> is the response variable; <x> is the optional group-id variable; <gamma0> is a parameter that specifies the hypothesized value; and where the <SUBSET/EXCEPT/FOR qualification> is optional. This syntax performs a two-tailed test. If there are no groups in the data, the group-id variable can be omitted. The <gamma0> can either be given on this command or specified before entering this command by entering
If the <x> variable is given, it should have the same number of rows as the <y> variable.
TEST <y> <x> <gamma0> <SUBSET/EXCEPT/FOR qualification> where <y> is the response variable; <x> is the optional group-id variable; <gamma0> is a parameter that specifies the hypothesized value; and where the <SUBSET/EXCEPT/FOR qualification> is optional. This syntax performs a one-tailed test. If LOWER is entered, then the alternate hypothesis is
If UPPER is entered, then the alternative hypothesis is
If there are no groups in the data, the group-id variable can be omitted. The <gamma0> can either be given on this command or specified before entering this command by entering
If the <x> variable is given, it should have the same number of rows as the <y> variable.
<SUBSET/EXCEPT/FOR qualification> where <y1> is the first response variable; <x1> is the optional first group-id variable; <y2> is the second response variable; <x2> is the optional second group-id variable; and where the <SUBSET/EXCEPT/FOR qualification> is optional. This syntax performs a two-tailed test. If there are no groups in the data, the group-id variables can be omitted. However, if a group-id variable is specified for one response variable, it should also be specified for the second response variable. If one of the response variables has groups but the other response variable does not, then a group-id variable can be created that has all values equal to 1.
The <y1> and <x1> variables should have the same number of
rows. Likewise the <y2> and <x2> variables should have
the same number of rows. However, <y1> and
TEST <y1> <x1> <y2> <x2> <SUBSET/EXCEPT/FOR qualification> where <y1> is the first response variable; <x1> is the optional first group-id variable; <y2> is the second response variable; <x2> is the optional second group-id variable; and where the <SUBSET/EXCEPT/FOR qualification> is optional. This syntax performs a one-tailed test. If LOWER is entered, then the alternate hypothesis is
If UPPER is entered, then the alternative hypothesis is
If there are no groups in the data, the group-id variable can be omitted. If there are no groups in the data, the group-id variables can be omitted. However, if a group-id variable is specifiend for one response variable, it should also be specified for the second response variable. If one of the response variables has groups but the other response variable does not, then a group-id variable can be created that has all values equal to 1. The <y1> and <x1> variables should have the same number of rows. Likewise the <y2> and <x2> variables should have the same number of rows. However, <y1> and <y2> need not have the same number of rows.
ONE SAMPLE COEFFICIENT OF VARIATION TEST Y GAMMA0 ONE SAMPLE COEFFICIENT OF VARIATION TEST Y X GAMMA0 ONE SAMPLE COEFFICIENT OF VARIATION UPPER TAILED TEST ... Y X GAMMA0 ONE SAMPLE COEFFICIENT OF VARIATION TEST Y X GAMMA0 ... SUBSET X > 2
TWO SAMPLE COEFFICIENT OF VARIATION TEST Y1 Y2
Y X LET A = ONE SAMPLE COEFFICIENT OF VARIATION TEST ... CDF Y X LET A = ONE SAMPLE COEFFICIENT OF VARIATION TEST ... PVALUE Y X LET A = ONE SAMPLE COEFFICIENT OF VARIATION LOWER ... PVALUE Y X LET A = ONE SAMPLE COEFFICIENT OF VARIATION UPPER ... PVALUE Y X
LET A = TWO SAMPLE COEFFICIENT OF VARIATION TEST ... The LOWER PVALUE and UPPER PVALUE refer to the p-values based on lower tailed and upper tailed tests, respectively. For the one sample test, these statistics can be computed from summary data as well
TEST YMEAN YSD YN LET A = SUMMARY ONE SAMPLE COEFFICIENT OF VARIATION ... CDF YMEAN YSD YN LET A = SUMMARY ONE SAMPLE COEFFICIENT OF VARIATION ... PVALUE where YMEAN, YSD, and YN are arrays that contain the sample means, sample standard deviations, and sample sizes, respectively. In addition to the above LET commands, built-in statistics are supported for 20+ different commands (enter HELP STATISTICS for details).
where
To use the Miller test, enter the command (before the TWO SAMPLE COEFFICENT OF VARIATION TEST command)
To reset the default Forkman test, enter
Miller (1991), "Asymptotic Test Statistics for Coefficient of Variation", Communications in Statistics - Theory and Methods, Vol. 20, pp. 3351-3363. McKay (1932), "Distributions of the Coefficient of Variation and the Extended 't' Distribution", Journal of the Royal Statistical Society, Vol. 95, pp. 695-698. Krishnamoorthy and Lee (2014), "Improved Tests for the Equality of Normal Coefficients of Variation", Computational Statistics, Vol. 29, pp. 215-232.
. Step 1: Read the data
.
skip 25
read gear.dat y x
skip 0
set write decimals 6
.
. Step 2: Define plot control
.
title case asis
title offset 2
label case asis
.
y1label Coefficient of Variation
x1label Group
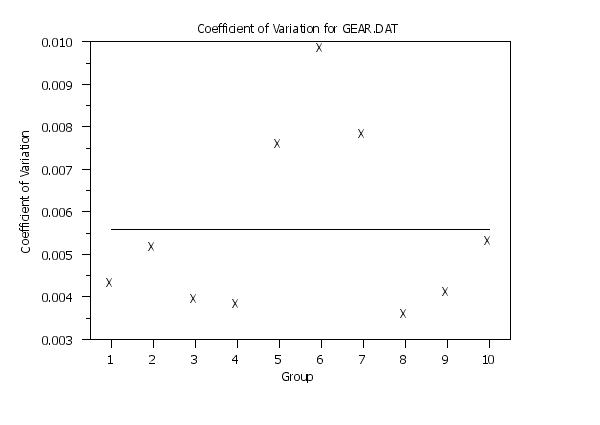
title Coefficient of Variation for GEAR.DAT
let ngroup = unique x
xlimits 1 ngroup
major x1tic mark number ngroup
minor x1tic mark number 0
tic mark offset units data
x1tic mark offset 0.5 0.5
y1tic mark label decimals 3
.
character X
line blank
.
.
. Step 3: Plot the coefficient of variation over the batches
.
set statistic plot reference line average
coefficient of variation plot y x
.
. Step 4: Demonstrate the LET commands for the test statistics
. using raw data
.
let gamma0 = 0.005
let statval = one sample coef of variation test y x
let statcdf = one sample coef of variation test cdf y x
let pvalue = one sample coef of variation test pvalue y x
let pvall = one sample coef of variation lower pvalue y x
let pvalu = one sample coef of variation upper pvalue y x
print statval statcdf pvalue pvall pvalu
.
. Step 4: Demonstrate the LET commands for the test statistics
. using summary data
.
set let cross tabulate collapse
let ymean = cross tabulate mean y x
let ysd = cross tabulate sd y x
let yn = cross tabulate size x
.
let statval2 = summary one sample coef of variation test ymean ysd yn
let statcdf2 = summary one sample coef of variation cdf ymean ysd yn
let pvalue2 = summary one sample coef of variation pvalue ymean ysd yn
print statval2 statcdf2 pvalue2
.
. Step 5: Hypothesis test for common coefficient of variation
.
let gamma0 = 0.005
one sample coefficient of variation test y x
one sample coefficient of variation upper tail test y x
one sample coefficient of variation lower tail test y x
The following output is generated.
. Step 1:   Read the data
.
skip 25
read auto83b.dat y1 y2
skip 0
set write decimals 6
retain y2 subset y2 > 0
.
. Test for equal coefficient of variation
.
let statval = two sample coef of variation test         y1 y2
let statcdf = two sample coef of variation test cdf     y1 y2
let pvalue  = two sample coef of variation test pvalue  y1 y2
let pvall   = two sample coef of variation lower pvalue y1 y2
let pvalu   = two sample coef of variation upper pvalue y1 y2
print statval statcdf pvalue pvall pvalu
.
. Test for equal coefficient of variation
.
two sample coefficient of variation test y1 y2
two sample coefficient of variation lower tail test y1 y2
two sample coefficient of variation upper tail test y1 y2
set two sample coefficient of variation test miller
two sample coefficient of variation test y1 y2
two sample coefficient of variation lower tail test y1 y2
two sample coefficient of variation upper tail test y1 y2
The following output is generated.
 PARAMETERS AND CONSTANTS--

    STATVAL --       2.384724
    STATCDF --       0.999992
    PVALUE  --       0.000015
    PVALL   --       0.999992
    PVALU   --       0.000008

            Forkman Two Sample Test for Equal Coefficient of Variations

First Response Variable:  Y1
Second Response Variable: Y2

H0: Population Coefficients of Variation
    Are Equal (gamma1 = gamma2)
Ha: gamma1 <> gamma2

Sample One Summary Statistics:
Total Number of Observations:            249
Number of Groups Included:               1
Sample Mean:                             20.144578
Sample Standard Deviation:               6.414699
Sample Coefficient of Variation:         0.318433

Sample Two Summary Statistics:
Total Number of Observations:            79
Number of Included Groups:               1
Sample Mean:                             30.481013
Sample Standard Deviation:               6.107710
Sample Coefficient of Variation:         0.200378

Forkman Test Statistic Value:            2.384724
Degrees of Freedom                       248
Degrees of Freedom                       78
CDF Value:                               0.999992
P-Value (2-tailed test):                 0.000015
P-Value (lower-tailed test):             0.999992
P-Value (upper-tailed test):             0.000008


            Forkman Two Sample Test for Equal Coefficient of Variations

H0: gamma1 = gamma2; Ha: gamma1 <> gamma2
---------------------------------------------------------------------------
                                        Lower          Upper           Null
   Significance           Test       Critical       Critical     Hypothesis
          Level      Statistic          Value          Value     Conclusion
---------------------------------------------------------------------------
          50.0%       2.384724       0.889585       1.140474         REJECT
          80.0%       2.384724       0.798111       1.280145         REJECT
          90.0%       2.384724       0.748580       1.373470         REJECT
          95.0%       2.384724       0.708464       1.461059         REJECT
          99.0%       2.384724       0.636939       1.652378         REJECT
          99.9%       2.384724       0.563977       1.913576         REJECT


            Forkman Two Sample Test for Equal Coefficient of Variations

First Response Variable:  Y1
Second Response Variable: Y2

H0: Population Coefficients of Variation
    Are Equal (gamma1 = gamma2)
Ha: gamma1 < gamma2

Sample One Summary Statistics:
Total Number of Observations:            249
Number of Groups Included:               1
Sample Mean:                             20.144578
Sample Standard Deviation:               6.414699
Sample Coefficient of Variation:         0.318433

Sample Two Summary Statistics:
Total Number of Observations:            79
Number of Included Groups:               1
Sample Mean:                             30.481013
Sample Standard Deviation:               6.107710
Sample Coefficient of Variation:         0.200378

Forkman Test Statistic Value:            2.384724
Degrees of Freedom                       248
Degrees of Freedom                       78
CDF Value:                               0.999992
P-Value (2-tailed test):                 0.000015
P-Value (lower-tailed test):             0.999992
P-Value (upper-tailed test):             0.000008


            Lower One-Tailed Test

H0: gamma1 = gamma2; Ha: gamma1 < gamma2
------------------------------------------------------------
                                                        Null
   Significance           Test       Critical     Hypothesis
          Level      Statistic      Value (<)     Conclusion
------------------------------------------------------------
          50.0%       2.384724       1.005895         REJECT
          80.0%       2.384724       0.863240         REJECT
          90.0%       2.384724       0.798111         REJECT
          95.0%       2.384724       0.748580         REJECT
          99.0%       2.384724       0.664874         REJECT
          99.9%       2.384724       0.583430         REJECT


            Forkman Two Sample Test for Equal Coefficient of Variations

First Response Variable:  Y1
Second Response Variable: Y2

H0: Population Coefficients of Variation
    Are Equal (gamma1 = gamma2)
Ha: gamma1 > gamma2

Sample One Summary Statistics:
Total Number of Observations:            249
Number of Groups Included:               1
Sample Mean:                             20.144578
Sample Standard Deviation:               6.414699
Sample Coefficient of Variation:         0.318433

Sample Two Summary Statistics:
Total Number of Observations:            79
Number of Included Groups:               1
Sample Mean:                             30.481013
Sample Standard Deviation:               6.107710
Sample Coefficient of Variation:         0.200378

Forkman Test Statistic Value:            2.384724
Degrees of Freedom                       248
Degrees of Freedom                       78
CDF Value:                               0.999992
P-Value (2-tailed test):                 0.000015
P-Value (lower-tailed test):             0.999992
P-Value (upper-tailed test):             0.000008


            Forkman Two Sample Test for Equal Coefficient of Variations

H0: gamma1 = gamma2; Ha: gamma1 <> gamma2
------------------------------------------------------------
                                        Lower           Null
   Significance           Test       Critical     Hypothesis
          Level      Statistic          Value     Conclusion
------------------------------------------------------------
          50.0%       2.384724       1.005895         ACCEPT
          80.0%       2.384724       1.177041         ACCEPT
          90.0%       2.384724       1.280145         ACCEPT
          95.0%       2.384724       1.373470         ACCEPT
          99.0%       2.384724       1.571455         ACCEPT
          99.9%       2.384724       1.835646         ACCEPT


THE FORTRAN COMMON CHARACTER VARIABLE TWO SAMP HAS JUST BEEN SET TO MILL

            Miller Two Sample Test for Equal Coefficient of Variations

First Response Variable:  Y1
Second Response Variable: Y2

H0: Population Coefficients of Variation
    Are Equal (gamma1 = gamma2)
Ha: gamma1 <> gamma2

Sample One Summary Statistics:
Number of Observations:                    249
Sample Mean:                               20.144578
Sample Standard Deviation:                 6.414699
Sample Coefficient of Variation:           0.318433

Sample Two Summary Statistics:
Number of Observations:                    79
Sample Mean:                               30.481013
Sample Standard Deviation:                 6.107710
Sample Coefficient of Variation:           0.200378

Miller Test Statistic Value:               4.100052
CDF Value:                                 0.999979
P-Value (2-tailed test):                   0.000041
P-Value (lower-tailed test):               0.999979
P-Value (upper-tailed test):               0.000021


            Miller Two Sample Test for Equal Coefficient of Variations

H0: gamma1 = gamma2; Ha: gamma1 <> gamma2
---------------------------------------------------------------------------
                                        Lower          Upper           Null
   Significance           Test       Critical       Critical     Hypothesis
          Level      Statistic          Value          Value     Conclusion
---------------------------------------------------------------------------
          50.0%       4.100052      -0.674490       0.674490         REJECT
          80.0%       4.100052      -1.281552       1.281552         REJECT
          90.0%       4.100052      -1.644854       1.644854         REJECT
          95.0%       4.100052      -1.959964       1.959964         REJECT
          99.0%       4.100052      -2.575829       2.575829         REJECT
          99.9%       4.100052      -3.290527       3.290527         REJECT


            Miller Two Sample Test for Equal Coefficient of Variations

First Response Variable:  Y1
Second Response Variable: Y2

H0: Population Coefficients of Variation
    Are Equal (gamma1 = gamma2)
Ha: gamma1 < gamma2

Sample One Summary Statistics:
Number of Observations:                    249
Sample Mean:                               20.144578
Sample Standard Deviation:                 6.414699
Sample Coefficient of Variation:           0.318433

Sample Two Summary Statistics:
Number of Observations:                    79
Sample Mean:                               30.481013
Sample Standard Deviation:                 6.107710
Sample Coefficient of Variation:           0.200378

Miller Test Statistic Value:               4.100052
CDF Value:                                 0.999979
P-Value (2-tailed test):                   0.000041
P-Value (lower-tailed test):               0.999979
P-Value (upper-tailed test):               0.000021


            Lower One-Tailed Test

H0: gamma1 = gamma2; Ha: gamma1 < gamma2
------------------------------------------------------------
                                                        Null
   Significance           Test       Critical     Hypothesis
          Level      Statistic      Value (<)     Conclusion
------------------------------------------------------------
          50.0%       4.100052       0.000000         REJECT
          80.0%       4.100052      -0.841621         REJECT
          90.0%       4.100052      -1.281552         REJECT
          95.0%       4.100052      -1.644854         REJECT
          99.0%       4.100052      -2.326348         REJECT
          99.9%       4.100052      -3.090232         REJECT


            Miller Two Sample Test for Equal Coefficient of Variations

First Response Variable:  Y1
Second Response Variable: Y2

H0: Population Coefficients of Variation
    Are Equal (gamma1 = gamma2)
Ha: gamma1 > gamma2

Sample One Summary Statistics:
Number of Observations:                    249
Sample Mean:                               20.144578
Sample Standard Deviation:                 6.414699
Sample Coefficient of Variation:           0.318433

Sample Two Summary Statistics:
Number of Observations:                    79
Sample Mean:                               30.481013
Sample Standard Deviation:                 6.107710
Sample Coefficient of Variation:           0.200378

Miller Test Statistic Value:               4.100052
CDF Value:                                 0.999979
P-Value (2-tailed test):                   0.000041
P-Value (lower-tailed test):               0.999979
P-Value (upper-tailed test):               0.000021


            Miller Two Sample Test for Equal Coefficient of Variations

H0: gamma1 = gamma2; Ha: gamma1 <> gamma2
------------------------------------------------------------
                                        Lower           Null
   Significance           Test       Critical     Hypothesis
          Level      Statistic          Value     Conclusion
------------------------------------------------------------
          50.0%       4.100052       0.000000         ACCEPT
          80.0%       4.100052       0.841621         ACCEPT
          90.0%       4.100052       1.281552         ACCEPT
          95.0%       4.100052       1.644854         ACCEPT
          99.0%       4.100052       2.326348         ACCEPT
          99.9%       4.100052       3.090232         ACCEPT
Date created: 06/27/2017 |
Last updated: 12/11/2023 Please email comments on this WWW page to [email protected]. | |||||||||||||||||||||||||||||||||||||||||||||||||||||||||||||||||||||||||||||||||