
|
|
COMMON COEFFICIENT OF VARIATION CONFIDENCE LIMITSName:
where \( \sigma \) and \( \mu \) denote the population standard deviation and population mean, respectively. The sample coefficient of variation is defined as
where s and \( \bar{x} \) denote the sample standard deviation and sample mean respectively. The coefficient of variation should typically only be used for ratio data. That is, the data should be continuous and have a meaningful zero. Although the coefficient of variation statistic can be computed for data that is not on a ratio scale, the interpretation of the coeffcient of variation may not be meaningful. Currently, this command is only supported for non-negative data. If the response variable contains one or more negative numbers, an error message will be returned. For a single sample of normally distributed data, the command
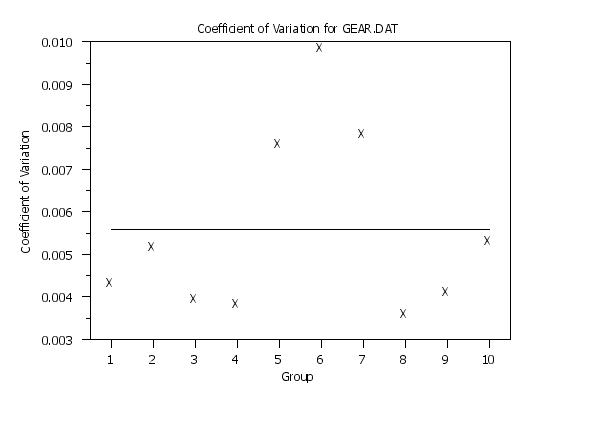
can be used to determine a confidence interval (this command supports six different methods for obtaining the confidence interval). The command documented here is for the case where there are two or more groups of data and we want to find a confidence interval for the common coefficient of variation for all groups. This command assumes that the data for each group is approximately normally distributed and that each group has the same coefficient of variation. For that reason, it is desirable to plot the coefficient of variation for each group (see the program example below) to check if this is a reasonable assumption. The biased common coefficient of variation is
where
A bias correccted estimate of the common coefficient of variation is
The confidence limits are computed as
Upper Limit = \( \sqrt{ \frac{\sum_{i}^{k}{(N_{i} - 1) u_{i}}} {\chi_{\alpha/2}^{2} - \sum_{i}^{k}{(N_{i} - 1) u_{i}}} } \) where
This confidence interval was proposed by Forkman (see References below).
LIMITS <y> <x> <SUBSET/EXCEPT/FOR qualification> where <y> is the response variable; <x> is the group-id variable; and where the <SUBSET/EXCEPT/FOR qualification> is optional. If LOWER is specified, a one-sided lower confidence limit is returned. If UPPER is specified, a one-sided upper confidence limit is returned. If neither is specified, a two-sided limit is returned. This syntax does not support matrix arguments for the response and group-id variables.
CONFIDENCE LIMITS <y1> ... <yk> <SUBSET/EXCEPT/FOR qualification> where <y1> .... <yk> is a list of 1 to 30 response variables; and where the <SUBSET/EXCEPT/FOR qualification> is optional. This syntax can be used if the groups are in separate variables. You can use the TO syntax as in
If LOWER is specified, a one-sided lower confidence limit is returned. If UPPER is specified, a one-sided upper confidence limit is returned. If neither is specified, a two-sided limit is returned. This syntax supports matrix arguments for the response variables.
COMMON COEFFICIENT OF VARIATION CONFIDENCE LIMITS Y1 X1 ... SUBSET X1 > 2 MULTIPLE COMMON COEFFICIENT OF VARIATION CONFIDENCE LIMITS ... Y1 TO Y5
LET A = COMMON COEFFICIENT OF VARIATION Y X The LET ALPHA command specifies the significance level. In addition to the above LET commands, built-in statistics are supported for 20+ different commands (enter HELP STATISTICS for details).
McKay (1932), "Distributions of the Coefficient of Variation and the Extended 't' Distribution", Journal of the Royal Statistical Society, Vol. 95, pp. 695-698.
. Step 1:   Create the data
.
skip 25
read gear.dat y x
skip 0
set write decimals 6
.
. Step 2:   Define plot control settings and plot the data
.
title case asis
title offset 2
label case asis
.
y1label Coefficient of Variation
x1label Group
title Coefficient of Variation for GEAR.DAT
let ngroup = unique x
xlimits 1 ngroup
major x1tic mark number ngroup
minor x1tic mark number 0
tic mark offset units data
x1tic mark offset 0.5 0.5
y1tic mark label decimals 3
.
character X
line blank
.
set statistic plot reference line average
.
coefficient of variation plot y x
.
. Step 3:   Define plot control settings and plot the data
.
common coefficient of variation confidence limits y x
            Two-Sided Confidence Limits for the Common Coefficient
                  of Variation for Normally Distributed Data

Method: Forkman
Response Variable: Y
Group-ID Variable: X

Number of Distinct Groups:               10
Number of Groups Included in Analysis:   10
Common Coefficient of Variation:         0.005953
Bias Corrected Estimate:                 0.005969


---------------------------------------------------------
  Confidence    Coefficient          Lower          Upper
   Value (%)   of Variation          Limit          Limit
---------------------------------------------------------
        50.0       0.005953       0.005686       0.006289
        80.0       0.005953       0.005445       0.006596
        90.0       0.005953       0.005309       0.006792
        95.0       0.005953       0.005196       0.006970
        99.0       0.005953       0.004985       0.007340
        99.9       0.005953       0.004759       0.007810
Date created: 06/23/2017 |
Last updated: 12/11/2023 Please email comments on this WWW page to [email protected]. | |||||||||||||||||||||||||||||||||||||||||||