5.4. Analysis of DOE data
5.4.1. |
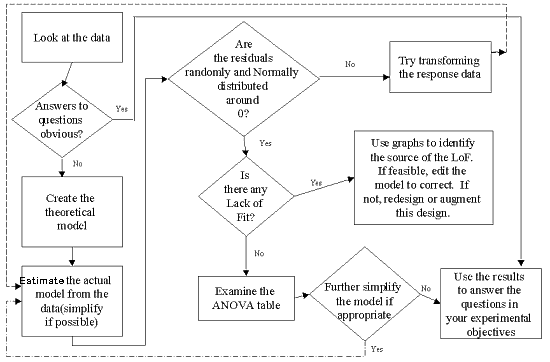
What are the steps in a DOE analysis? |

- Look at the data. Examine it for outliers, typos and obvious problems. Construct as many graphs as you can to get the big picture.
- Response distributions (histograms, box plots, etc.)
- Responses versus time order scatter plot (a check for possible time effects)
- Responses versus factor levels (first look at magnitude of factor effects)
- Typical DOE plots (which assume standard models for effects and errors)
- Main effects mean plots
- Block plots
- Normal or half-normal plots of the effects
- Interaction plots
- Sometimes the right graphs and plots of the data lead to obvious answers for your experimental objective questions and you can skip to step 5. In most cases, however, you will want to continue by fitting and validating a model that can be used to answer your questions.
- Create the theoretical model (the experiment should have been designed with this model in mind!).
- Create a model from the data. Simplify the model, if possible, using stepwise regression methods and/or parameter p-value significance information.
- Test the model assumptions using residual graphs.
- If none of the model assumptions were violated, examine the ANOVA.
- Simplify the model further, if appropriate. If reduction is appropriate, then return to step 3 with a new model.
- If model assumptions were violated, try to find a cause.
- Are necessary terms missing from the model?
- Will a transformation of the response help? If a transformation is used, return to step 3 with a new model.
- Use the results to answer the questions in your experimental objectives -- finding important factors, finding optimum settings, etc.
-fast rule

