Next Page Previous Page Home Tools & Aids Search Handbook
3. Production Process Characterization
3.5. Case Studies
3.5.1. Furnace Case Study

3.5.1.3.

Identify Sources of Variation

The next part of the analysis is to break down the sources of variation.
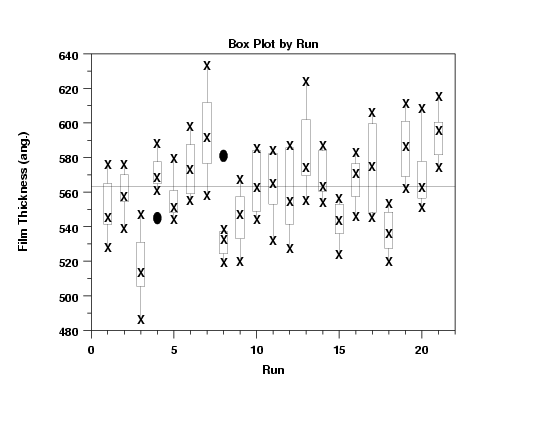
Box Plot by Run The following is a box plot of the thickness by run number.

box plot by run

Conclusions From Box Plot We can make the following conclusions from this box plot.
  1. There is significant run-to-run variation.

  2. Although the means of the runs are different, there is no discernable trend due to run.

  3. In addition to the run-to-run variation, there is significant within-run variation as well. This suggests that a box plot by furnace location may be useful as well.
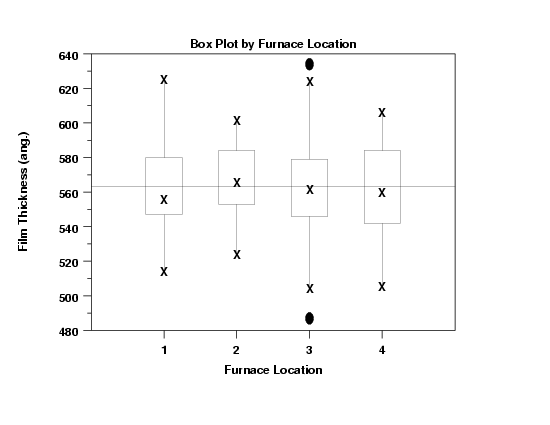
Box Plot by Furnace Location The following is a box plot of the thickness by furnace location.

box plot by zone

Conclusions From Box Plot We can make the following conclusions from this box plot.
  1. There is considerable variation within a given furnace location.

  2. The variation between furnace locations is small. That is, the locations and scales of each of the four furnace locations are fairly comparable (although furnace location 3 seems to have a few mild outliers).
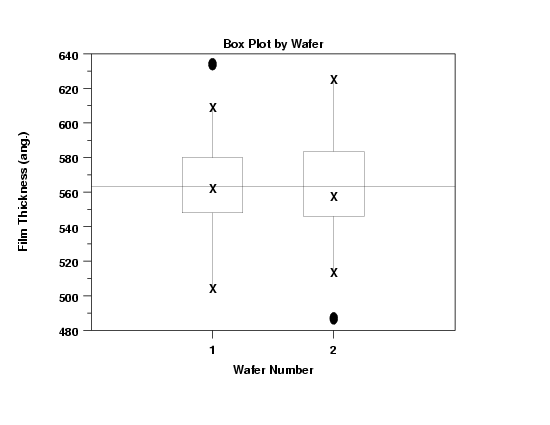
Box Plot by Wafer The following is a box plot of the thickness by wafer.

box plot by wafer

Conclusion From Box Plot From this box plot, we conclude that wafer does not seem to be a significant factor.
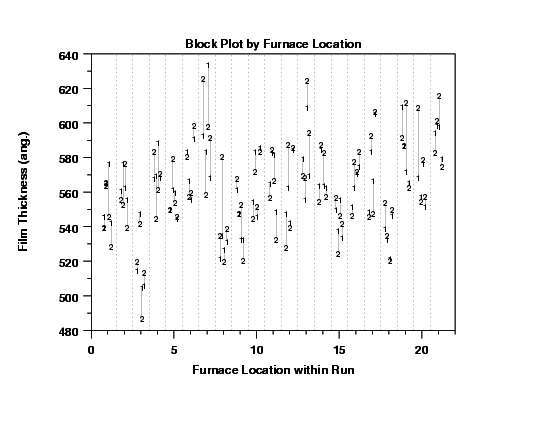
Block Plot In order to show the combined effects of run, furnace location, and wafer, we draw a block plot of the thickness. Note that for aesthetic reasons, we have used connecting lines rather than enclosing boxes.

block plot of film thickness by run, zone,wafer

Conclusions From Block Plot We can draw the following conclusions from this block plot.
  1. There is significant variation both between runs and between furnace locations. The between-run variation appears to be greater.

  2. Run 3 seems to be an outlier.
Home Tools & Aids Search Handbook Previous Page Next Page