1.3. EDA Techniques
1.3.3. Graphical Techniques: Alphabetic
1.3.3.7. |
Box Plot |
Check location and variation shifts
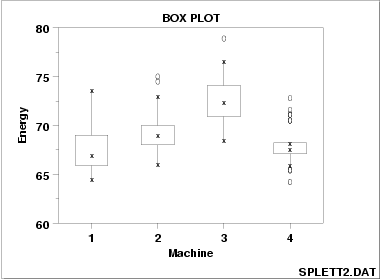
This box plot reveals that machine has a significant effect on energy with respect to location and possibly variation

This box plot, comparing four machines for energy output, shows that machine has a significant effect on energy with respect to both location and variation. Machine 3 has the highest energy response (about 72.5); machine 4 has the least variable energy response with about 50% of its readings being within 1 energy unit.
-
Vertical axis: Response variable
Horizontal axis: The factor of interest
- Calculate the median and the
quartiles (the lower quartile
is the 25th percentile and the upper quartile is the 75th
percentile).
- Plot a symbol at the median (or draw a line) and draw a box (hence the name--box plot) between the lower and upper quartiles; this box represents the middle 50% of the data--the "body" of the data.
- Draw a line from the lower quartile to the minimum point and another line from the upper quartile to the maximum point. Typically a symbol is drawn at these minimum and maximum points, although this is optional.
- Calculate the median and the
lower and upper quartiles.
- Plot a symbol at the median and draw a box between the lower and upper quartiles.
- Calculate the interquartile range (the difference between the upper and lower quartile) and call it IQ.
- Calculate the following points:
-
L1 = lower quartile - 1.5*IQ
L2 = lower quartile - 3.0*IQ
U1 = upper quartile + 1.5*IQ
U2 = upper quartile + 3.0*IQ
- The line from the lower quartile to the minimum is now drawn from the lower quartile to the smallest point that is greater than L1. Likewise, the line from the upper quartile to the maximum is now drawn to the largest point smaller than U1.
- Points between L1 and L2 or between U1 and U2 are drawn as small circles. Points less than L2 or greater than U2 are drawn as large circles.
- Is a factor significant?
- Does the location differ between subgroups?
- Does the variation differ between subgroups?
- Are there any outliers?
Check the significance of a factor
The box plot is also an effective tool for summarizing large quantities of information.
Analysis of Variance

