1.3. EDA Techniques
1.3.3. Graphical Techniques: Alphabetic
1.3.3.24. |
Quantile-Quantile Plot |
Check If Two Data Sets Can Be Fit With the Same Distribution
A q-q plot is a plot of the quantiles of the first data set against the quantiles of the second data set. By a quantile, we mean the fraction (or percent) of points below the given value. That is, the 0.3 (or 30%) quantile is the point at which 30% percent of the data fall below and 70% fall above that value.
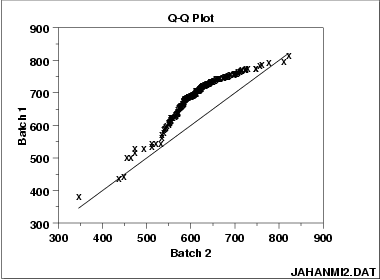
A 45-degree reference line is also plotted. If the two sets come from a population with the same distribution, the points should fall approximately along this reference line. The greater the departure from this reference line, the greater the evidence for the conclusion that the two data sets have come from populations with different distributions.
The advantages of the q-q plot are:
- The sample sizes do not need to be equal.
- Many distributional aspects can be simultaneously tested. For example, shifts in location, shifts in scale, changes in symmetry, and the presence of outliers can all be detected from this plot. For example, if the two data sets come from populations whose distributions differ only by a shift in location, the points should lie along a straight line that is displaced either up or down from the 45-degree reference line.
The q-q plot is similar to a probability plot. For a probability plot, the quantiles for one of the data samples are replaced with the quantiles of a theoretical distribution.

This q-q plot of the JAHANMI2.DAT data set shows that
- These 2 batches do not appear to have come from populations with a common distribution.
- The batch 1 values are significantly higher than the corresponding batch 2 values.
- The differences are increasing from values 525 to 625. Then the values for the 2 batches get closer again.
Quantiles for Data Set 1 Versus Quantiles of Data Set 2
- Vertical axis: Estimated quantiles from data set 1
- Horizontal axis: Estimated quantiles from data set 2
Both axes are in units of their respective data sets. That is, the actual quantile level is not plotted. For a given point on the q-q plot, we know that the quantile level is the same for both points, but not what that quantile level actually is.
If the data sets have the same size, the q-q plot is essentially a plot of sorted data set 1 against sorted data set 2. If the data sets are not of equal size, the quantiles are usually picked to correspond to the sorted values from the smaller data set and then the quantiles for the larger data set are interpolated.
- Do two data sets come from populations with a common distribution?
- Do two data sets have common location and scale?
- Do two data sets have similar distributional shapes?
- Do two data sets have similar tail behavior?
T Test
F Test
2-Sample Chi-Square Test
2-Sample Kolmogorov-Smirnov Test

