1.3. EDA Techniques
1.3.3. Graphical Techniques: Alphabetic
1.3.3.2. |
Bihistogram |
Check for a change in location, variation, or distribution
- location;
- variation; or
- distribution.
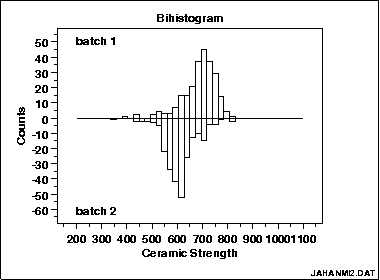
This bihistogram reveals that there is a significant difference in ceramic breaking strength between batch 1 (above) and batch 2 (below)

From the above bihistogram of the JAHANMI2.DAT data set, we can see that batch 1 is centered at a ceramic strength value of approximately 725 while batch 2 is centered at a ceramic strength value of approximately 625. That indicates that these batches are displaced by about 100 strength units. Thus the batch factor has a significant effect on the location (typical value) for strength and hence batch is said to be "significant" or to "have an effect". We thus see graphically and convincingly what a t-test or analysis of variance would indicate quantitatively.
With respect to variation, note that the spread (variation) of the above-axis batch 1 histogram does not appear to be that much different from the below-axis batch 2 histogram. With respect to distributional shape, note that the batch 1 histogram is skewed left while the batch 2 histogram is more symmetric with even a hint of a slight skewness to the right.
Thus the bihistogram reveals that there is a clear difference between the batches with respect to location and distribution, but not in regard to variation. Comparing batch 1 and batch 2, we also note that batch 1 is the "better batch" due to its 100-unit higher average strength (around 725).
Two adjoined histograms
- Above the axis: Histogram of the response variable for condition 1
- Below the axis: Histogram of the response variable for condition 2
- Is a (2-level) factor significant?
- Does a (2-level) factor have an effect?
- Does the location change between the 2 subgroups?
- Does the variation change between the 2 subgroups?
- Does the distributional shape change between subgroups?
- Are there any outliers?
Checks 3 out of the 4 underlying assumptions of a measurement process
F test (for shift in variation)
Kolmogorov-Smirnov test (for shift in distribution)
Quantile-quantile plot (for shift in location and distribution)

