1.3. EDA Techniques
1.3.3. Graphical Techniques: Alphabetic
1.3.3.6. |
Box-Cox Normality Plot |
Find transformation to normalize data
The Box-Cox transformation is a particulary useful family of transformations. It is defined as:

 is the transformation parameter.
For
  = 0, the log of the data is taken
instead of using the above formula.
Given a particular transformation, it is helpful to define a measure of the normality of the resulting transformation. One measure is to compute the correlation coefficient of a normal probability plot. The correlation is computed between the vertical and horizontal axis variables of the probability plot and is a convenient measure of the linearity of the probability plot (the more linear the probability plot, the better a normal distribution fits the data).
The Box-Cox normality plot is a plot of these correlation coefficients
for various values of the lambda parameter. The value of lambda
corresponding to the maximum correlation on the plot is then the
optimal choice for  .
.

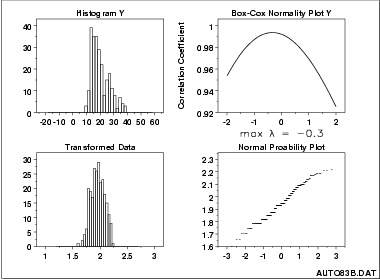
The histogram in the upper left-hand shows a data set that has
significant right skewness (and so does not follow a normal
distribution). The Box-Cox normality plot shows that the maximum
value of the correlation coefficient is at
 = -0.3.
The histogram of the data after applying the Box-Cox transformation
with
  = -0.3.
shows a data set for which the normality assumption is reasonable.
This is verified with a normal probability plot of the transformed
data.
- Vertical axis: Correlation coefficient from the normal
probability plot after applying Box-Cox transformation
- Horizontal axis: Value for

- Is there a transformation that will normalize my data?
- What is the optimal value of the transformation parameter?
Normalization improves validity of tests
Box-Cox Linearity Plot

