1.3. EDA Techniques
1.3.3. Graphical Techniques: Alphabetic
1.3.3.5. |
Box-Cox Linearity Plot |
Find the transformation of the X variable that maximizes the correlation between a Y and an X variable
-
\[ T(X) = (X^{\lambda} - 1)/\lambda \]
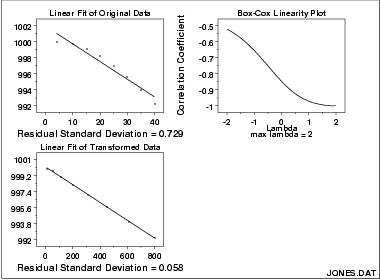
The Box-Cox linearity plot is a plot of the correlation between Y and the transformed X for given values of \( \lambda \). That is, \( \lambda \) is the coordinate for the horizontal axis variable and the value of the correlation between Y and the transformed X is the coordinate for the vertical axis of the plot. The value of \( \lambda \) corresponding to the maximum correlation (or minimum for negative correlation) on the plot is then the optimal choice for \( \lambda \).
Transforming X is used to improve the fit. The Box-Cox transformation applied to Y can be used as the basis for meeting the error assumptions. That case is not covered here. See page 225 of (Draper and Smith, 1981) or page 77 of (Ryan, 1997) for a discussion of this case.

The plot of the original data with the predicted values from a linear fit indicate that a quadratic fit might be preferable. The Box-Cox linearity plot shows a value of \( \lambda \) = 2.0. The plot of the transformed data with the predicted values from a linear fit with the transformed data shows a better fit (verified by the significant reduction in the residual standard deviation).
- Vertical axis: Correlation coefficient from the transformed X and Y
- Horizontal axis: Value for \( \lambda \)
- Would a suitable transformation improve my fit?
- What is the optimal value of the transformation parameter?
Find a suitable transformation
Box-Cox Normality Plot

