
|
|
THRESHOLD MINIMUMName:
In some cases, you may be given a set of responses and a list of potential cutoff values. The THRESHOLD MINIMUM command can then be used to create the appropriate coded response variable for the ROC curve. Specifically, for each cutoff value, we compare each value in the response variable to the cutoff and return a 1 if the response is greater than or equal to the cutoff and a 0 if it less than the cutoff. The coded output response variable will have N*NCUTOFF rows where N and NCUTOFF denote the number of rows in the response variable and the number of threshold values, respectively. In addition, a group-id variable is returned which identifies the row number of the threshold value. The THRESHOLD MAXIMUM command is similar. However, the coding is 1 if the response value is less than or equal to the cutoff and 0 if it greater than the cutoff.
<SUBSET/EXCEPT/FOR qualification> where <x> is the response variable; <xval> is the variable containing the cutoff values; <y> is the generated coded response variable; <tag> is the generated group-id variable; and where the <SUBSET/EXCEPT/FOR qualification> is optional. This syntax is used when a "1" implies the response value is greater than or equal to the cutoff value.
<SUBSET/EXCEPT/FOR qualification> where <x> is the response variable; <xval> is the variable containing the cutoff values; <y> is the generated coded response variable; <tag> is the generated group-id variable; and where the <SUBSET/EXCEPT/FOR qualification> is optional. This syntax is used when a "1" implies the response value is less than or equal to the cutoff value.
LET Y TAG = THRESHOLD MAXIMUM X XCUTOFF LET Y TAG = THRESHOLD MAXIMUM X XCUTOFF SUBSET X > 0.2
. Step 1: Read the Data
.
. Column 1: Ground Truth (0 => live, 1 => dead)
. Column 2: Method 1 (low => live cell, high => dead cell)
. Column 3: Method 2 (high => live cell, low => dead cell)
dimension 40 columns
read alive percmat intensity
1 7.1 39.8
1 8.5 29.6
1 72.7 4.2
1 32.3 12.3
1 5.4 21.5
1 71.1 4.4
1 100.0 13.5
1 55.0 22.4
1 15.0 25.9
1 8.7 38.5
1 0.9 16.6
1 19.0 48.5
1 100.0 4.3
1 100.0 7.9
1 5.2 42.6
1 21.8 47.2
0 90.0 1.0
0 2.0 23.5
0 98.0 2.2
0 100.0 6.2
0 100.0 2.0
0 100.0 5.6
0 100.0 3.0
0 30.0 14.3
0 100.0 1.0
end of data
.
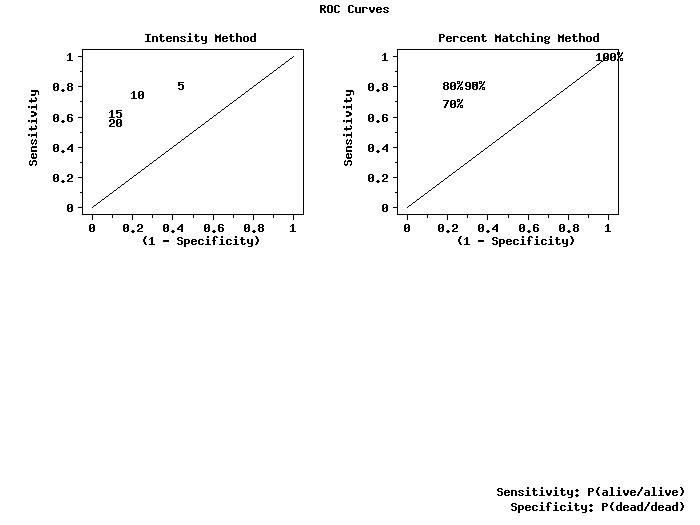
. Step 3: Generate ROC curves based on different levels of intensity
. and matching
.
multiplot corner coordinates 5 5 95 95
multiplot scale factor 2
multiplot 2 2
.
limits 0 1
major tic mark number 6
minor tic mark number 1
tic mark offset 0.05 0.05
character color black all
character case asis all
line blank all
line dotted
.
title offset 5
title case asis
label case asis
y1label Sensitivity
x1label (1 - Specificity)
y1label displacement 15
x1label displacement 12
title offset 2
.
. Use intensity levels of 5%, 10%, 15%, 20%
.
let intcut = data 5 10 15 20
let gt1 = combine alive alive alive alive
let intall groupid1 = threshold minimum intensity intcut
.
character blank blank 5 10 15 20
title Intensity Method
roc curve gt1 intall groupid1
.
. Use matching levels of 70, 80, 90, 95, 100 for cell 1
.
let matcut = data 70 80 90 95 100
let gt2all = combine alive alive alive alive alive
let matall groupid2 = threshold maximum percmat matcut
let groupid2 = groupid2
.
character blank blank 70% 80% 90% 95% 100%
title Percent Matching Method
roc curve gt2all matall groupid2
.
end of multiplot
.
case asis
just right
height 1.5
move 98 5
text Sensitivity: P(alive/alive)
move 98 2
text Specificity: P(dead/dead)
.
just center
move 50 97
text ROC Curves
Date created: 08/03/2011 |