|
|
SIGNAL TO NOISE RATIOName:
where s is the sample standard deviation and \( \bar{x} \) is the sample mean. This is the reciprocal of the coefficient of variation:
That is, it shows the variability, as defined by the standard deviation, relative to the mean. This definition of signal to noise ratio should typically only be used for data measured on a ratio scale. That is, the data should be continuous and have a meaningful zero. Measurement data in the physical sciences and engineering are often on a ratio scale. As an example, temperatures measured on a kelvin scale are on a ratio scale while temperaturs measured on a Celcius or Farenheit scale are interval scales rather than ratio scales. Given a set of temperature measurements, the signal to noise ratio on the Celcius scale will be different than the signal to noise ratio on the Farenheit scale. Note that this is only one specific definition of the signal to noise ratio. There are numerous other definitions in common usage that are not described here.
<SUBSET/EXCEPT/FOR qualification> where <y> is a response variable; <par> is a parameter where the signal to noise ratio value is saved; and where the <SUBSET/EXCEPT/FOR qualification> is optional.
<SUBSET/EXCEPT/FOR qualification> where <y1> is the first response variable; <y2> is the second response variable; <par> is a parameter where the difference of the signal to noise ratios is saved; and where the <SUBSET/EXCEPT/FOR qualification> is optional.
LET SNR = SIGNAL TO NOISE RATIO Y1 SUBSET TAG > 2
LET SNRDIFF = DIFFERENCE OF SIGNAL TO NOISE RATIO Y1 Y2
2017/03: Added DIFFERENCE OF SIGNAL TO NOISE
. Step 1: Create the data
.
skip 25
read zarr13.dat y
skip 0
set write decimals 6
.
let snr = signal to noise ratio y
let snr = round(snr,3)
.
. Step 2: Define plot control
.
title case asis
title offset 2
label case asis
.
y1label Signal to Noise Ratio
x1label Bootstrap Sample
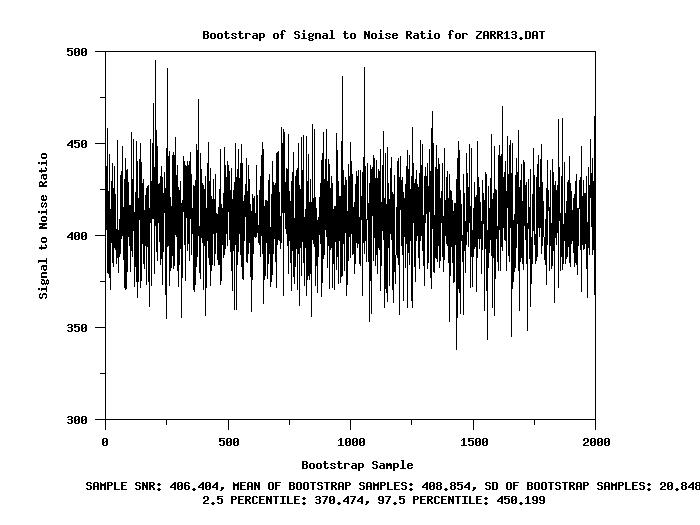
title Bootstrap of Signal to Noise Ratio for ZARR13.DAT
.
bootstrap samples 2000
bootstrap snr plot y
.
let bmean = round(bmean,3)
let bsd = round(bsd,3)
let b025 = round(b025,3)
let b975 = round(b975,3)
justification center
move 50 6
text Sample SNR: ^snr, Mean of Bootstrap Samples: ^bmean, SD of Bootstrap Samples: ^bsd
move 50 3.5
text 2.5 Percentile: ^B025, 97.5 Percentile: ^B975
            Bootstrap Analysis for the SIGNAL TO NOISE RATIO

Response Variable One: Y

Number of Bootstrap Samples:             2000
Number of Observations:                  195
Mean of Bootstrap Samples:               408.853631
Standard Deviation of Bootstrap Samples: 20.848402
Median of Bootstrap Samples:             408.357777
MAD of Bootstrap Samples:                13.975891
Minimum of Bootstrap Samples:            338.189159
Maximum of Bootstrap Samples:            495.148676


Percent Points of the Bootstrap Samples
-----------------------------------
  Percent Point               Value
-----------------------------------
            0.1    =     343.651065
            0.5    =     356.530068
            1.0    =     359.826113
            2.5    =     370.473897
            5.0    =     375.194264
           10.0    =     383.055240
           20.0    =     391.574737
           50.0    =     408.357777
           80.0    =     426.735022
           90.0    =     435.852705
           95.0    =     444.095509
           97.5    =     450.198916
           99.0    =     457.431107
           99.5    =     463.567638
           99.9    =     491.749619


            Percentile Confidence Interval for Statistic

------------------------------------------
  Confidence          Lower          Upper
 Coefficient          Limit          Limit
------------------------------------------
       50.00     394.902643     422.849973
       75.00     385.428649     433.131995
       90.00     375.194264     444.095509
       95.00     370.473897     450.198916
       99.00     356.530068     463.567638
       99.90     338.191889     495.146977
------------------------------------------
Program 2:
. Step 1: Create the data
.
skip 25
read gear.dat y x
skip 0
set write decimals 6
.
. Step 2: Define plot control
.
title case asis
title offset 2
label case asis
.
y1label Signal to Noise Ratio
x1label Group
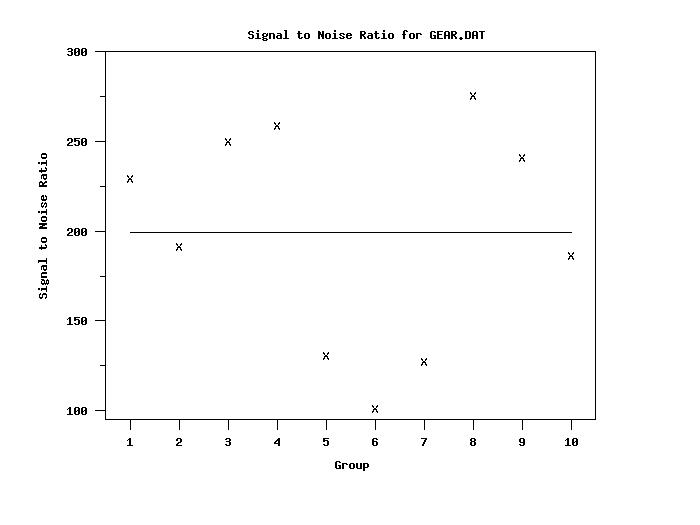
title Signal to Noise Ratio for GEAR.DAT
let ngroup = unique x
xlimits 1 ngroup
major x1tic mark number ngroup
minor x1tic mark number 0
tic mark offset units data
x1tic mark offset 0.5 0.5
y1tic mark offset 5 0
.
character X
line blank
.
set statistic plot reference line average
snr plot y x
.
tabulate snr y x
            Cross Tabulate SIGNAL TO NOISE RATIO

(Response Variables: Y        )
---------------------------------------------
       X          |   SIGNAL TO NOISE
---------------------------------------------
       1.000000   |        229.629318
       2.000000   |        191.529564
       3.000000   |        250.244129
       4.000000   |        259.081016
       5.000000   |        130.883795
       6.000000   |        101.031588
       7.000000   |        127.133680
       8.000000   |        275.815765
       9.000000   |        241.257602
      10.000000   |        186.670894
Program 3:
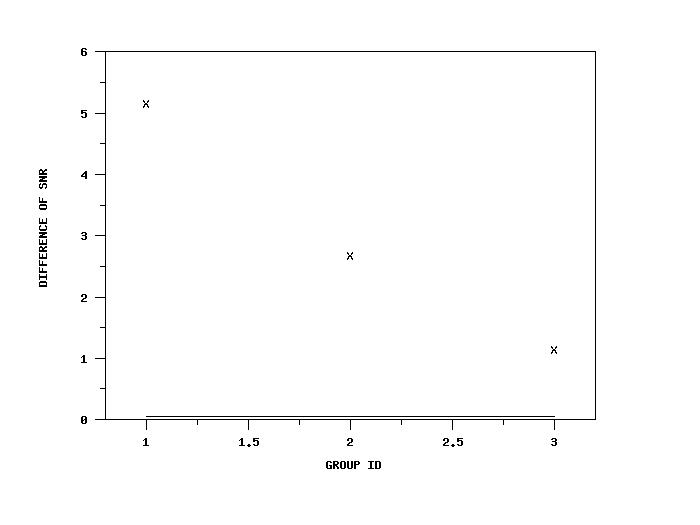
SKIP 25 READ IRIS.DAT Y1 TO Y4 X . LET A = DIFFERENCE OF SNR Y1 Y2 SET WRITE DECIMALS 4 TABULATE DIFFERENCE OF SNR Y1 Y2 X
|
Privacy
Policy/Security Notice
NIST is an agency of the U.S.
Commerce Department.
Date created: 03/06/2017 | ||||||||||||||||||||||