|
|
COEFFICIENT OF DISPERSIONName:
with \( \eta \) and \( \tau \) denoting the median and mean absolute deviation from the median, respectively. This statistic has been suggested as a robust alternative to the coefficient of variation.
<SUBSET/EXCEPT/FOR qualification> where <y> is a response variable; <par> is a parameter where the coefficient of dispersion value is saved; and where the <SUBSET/EXCEPT/FOR qualification> is optional.
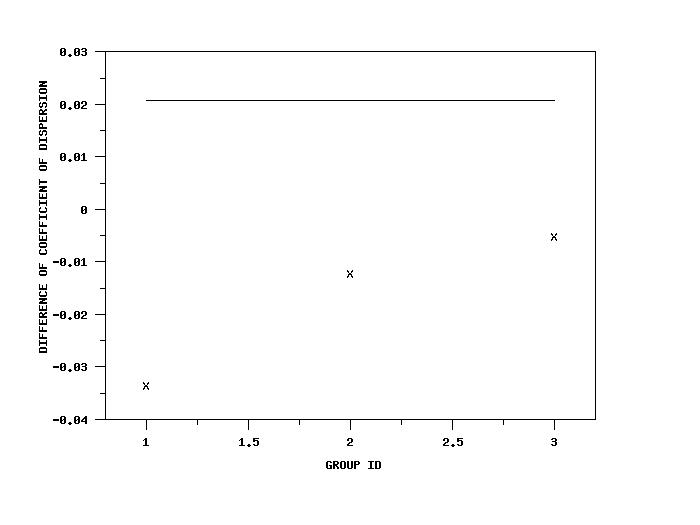
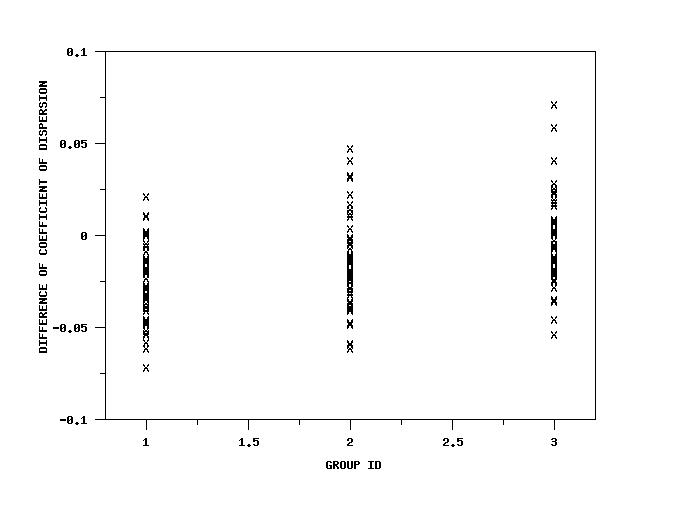
<SUBSET/EXCEPT/FOR qualification> where <y1> is the first response variable; <y2> is the second response variable; <par> is a parameter where the difference of the coefficient of dispersion values is saved; and where the <SUBSET/EXCEPT/FOR qualification> is optional.
LET COD = COEFFICIENT OF DISPERSION Y1 SUBSET TAG > 2
LET DIFFCOD = DIFFERENCE OF COEFFICIENT OF DISPERSION Y1 Y2
It is sometimes defined as
To compute this statistic in Dataplot, use the command
Note that 11/2017 version of Dataplot modified the scale factor to be the average absolute deviation from the median rather than the median absolute deviation from the median. This was done to be consistent with the Bonett paper. Basically, you can define a dispersion index based on a scale statistic (standard deviation, average absolute deviation, median absolute deviation, etc.) divided by a location statistic (mean, median, etc.). So there are additional possibilities not discussed here.
Gastwirth (1982), "Statistical properties as a measure of tax assessment uniformity", Journal of Statistical Planning Inference, Vol. 6, pp. 1-12.
2017/06: DIFFERENCE OF COEFFICIENT OF DISPERSION added 2017/11: Modified the definition to use the average absolute deviation from the median rather than the median absolute deviation from the median
SKIP 25
READ ZARR13.DAT Y
LET COD = COEFFICIENT OF DISPERSION Y
Program 2:
. Step 1: Create the data
.
skip 25
read gear.dat y x
skip 0
set write decimals 6
.
. Step 2: Define plot control
.
title case asis
title offset 2
label case asis
.
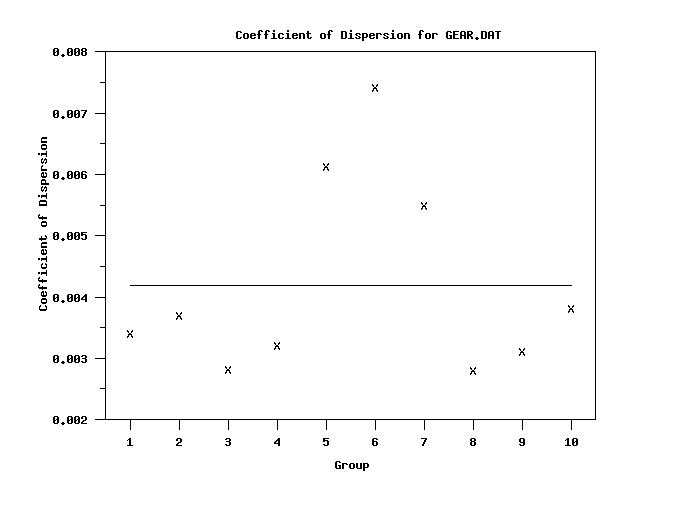
y1label Coefficient of Dispersion
x1label Group
title Coefficient of Dispersion for GEAR.DAT
let ngroup = unique x
xlimits 1 ngroup
major x1tic mark number ngroup
minor x1tic mark number 0
tic mark offset units data
x1tic mark offset 0.5 0.5
.
character X
line blank
.
set statistic plot reference line average
coefficient of dispersion plot y x
.
set write decimals 5
tabulate coefficient of dispersion y x
SKIP 25
READ IRIS.DAT Y1 TO Y4 X
.
LET A = DIFFERENCE OF COEFFICIENT OF DISPERSION Y1 Y2
SET WRITE DECIMALS 4
TABULATE DIFFERENCE OF COEFFICIENT Y1 Y2 X
|
Privacy
Policy/Security Notice
NIST is an agency of the U.S.
Commerce Department.
Date created: 01/24/2017 | |||||||||||||||||||||||||||||||