|
|
PEARSON DISSIMILARITYName:
PEARSON DISSIMILARITY (LET)
\( S_{yy} = \sum_{i=1}^{N}{(Y_{i} - \bar{Y})^{2}} \) \( S_{xy} = \sum_{i=1}^{N}{(Y_{i} - \bar{Y})(X_{i} - \bar{X})} \) \( r = \frac{S_{xy}}{\sqrt{S_{xx} S_{yy}}} \) A perfect linear relationship yields a correlation coefficient of +1 (or -1 for a negative relationship) and no linear relationship yields a correlation coefficient of 0. In some applications, such as clustering, it can be useful to transform the correlation coefficient to a dissimilarity measure. The transformation used here is
This converts the correlation coefficient with values between -1 and 1 to a score between 0 and 1. High positive correlation (i.e., very similar) results in a dissimilarity near 0 and high negative correlation (i.e., very dissimilar) results in a dissimilarity near 1. If a similarity score is preferred, you can use
where d is defined as above.
<SUBSET/EXCEPT/FOR qualification> where <y1> is the first response variable; <y2> is the second response variable; <par> is a parameter where the computed Pearson dissimilarity is stored; and where the <SUBSET/EXCEPT/FOR qualification> is optional.
<SUBSET/EXCEPT/FOR qualification> where <y1> is the first response variable; <y2> is the second response variable; <par> is a parameter where the computed Pearson similarity is stored; and where the <SUBSET/EXCEPT/FOR qualification> is optional.
LET A = PEARSON DISSIMILARITY Y1 Y2 SUBSET TAG > 2 LET A = PEARSON SIMILARITY Y1 Y2
2018/10: Added PEARSON SIMILARITY
SKIP 25
READ BERGER1.DAT Y X
LET CORR = CORRELATION Y X
LET D    = PEARSON DISSIMILARITY Y X
PRINT CORR D
The following output is generated
 PARAMETERS AND CONSTANTS--

    CORR    --          0.946
    D       --          0.027
Program 2:
SKIP 25
READ IRIS.DAT Y1 Y2 Y3 Y4
SET WRITE DECIMALS 3
.
LET M = GENERATE MATRIX PEARSON DISSIMILARITY Y1 Y2 Y3 Y4
PRINT M
The following output is generated
        MATRIX M       --            4 ROWS
                       --            4 COLUMNS

 VARIABLES--M1             M2             M3             M4

         -0.000          0.559          0.075          0.155
          0.559          0.000          0.736          0.534
          0.075          0.736          0.000          0.144
          0.155          0.534          0.144          0.000
Program 3:
SKIP 25
READ IRIS.DAT Y1 Y2 Y3 Y4 TAG
.
TITLE CASE ASIS
TITLE OFFSET 2
LABEL CASE ASIS
TIC MARK OFFSET UNITS DATA
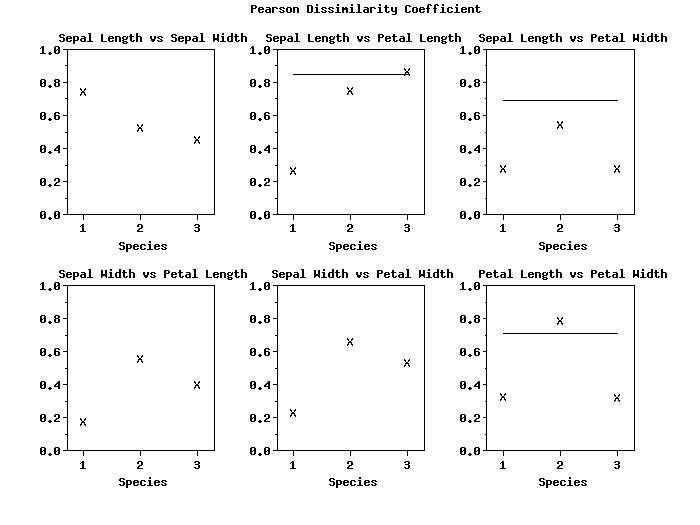
Y1LABEL Pearson Dissimilarity Coefficient
YLIMITS 0 1
MAJOR YTIC MARK NUMBER 6
MINOR YTIC MARK NUMBER 1
Y1TIC MARK LABEL DECIMAL 1
Y1LABEL DISPLACEMENT 20
X1LABEL Species
XLIMITS 1 3
MAJOR XTIC MARK NUMBER 3
MINOR XTIC MARK NUMBER 0
XTIC MARK OFFSET 0.3 0.3
X1LABEL DISPLACEMENT 14
CHARACTER X BLANK
LINES BLANK SOLID
.
MULTIPLOT CORNER COORDINATES 5 5 95 95
MULTIPLOT SCALE FACTOR 2
MULTIPLOT 2 3
.
TITLE Sepal Length vs Sepal Width
CORRELATION PLOT Y1 Y2 TAG
.
TITLE Sepal Length vs Petal Length
CORRELATION PLOT Y1 Y3 TAG
.
TITLE Sepal Length vs Petal Width
CORRELATION PLOT Y1 Y4 TAG
.
TITLE Sepal Width vs Petal Length
CORRELATION PLOT Y2 Y3 TAG
.
TITLE Sepal Width vs Petal Width
CORRELATION PLOT Y2 Y4 TAG
.
TITLE Petal Length vs Petal Width
CORRELATION PLOT Y3 Y4 TAG
.
END OF MULTIPLOT
| |||||||||||||||||||||||||||||