
|
|
ISO 13528 PA SCOREName:
with xref and \(\delta_{E}\) denoting the "assigned value" and the pre-defined allowance for measurement error, respectively. The multiplication by 100 is to express the score as a percentage. The Pa statistic is a performance score discussed in the ISO 13528 standard (2015 second edition pp. 25-26). Values of Pa ≤ -100 and Pa ≥ 100 indicate an action signal (i.e., unacceptable performance). Note that xref and \(\delta_{E}\) are not computed from the current data. The xref is considered the "true" value (or the best guess for the true value). The ISO 13528 standard discusses numerous ways of determining this value. The \( \delta_{E} \) is an "acceptable" error. Although the ISO 13258 standard does not define a specific method for determing \( \delta_{E} \), if estimates for the repeatability and reproducibility are available, then ISO 13528 suggests the following (p. 22)
where
Then
The justification for this is that this corresponds to an action signal of +/-3 for z-scores. In some cases, \( \sigma_{pt} \) may be based on fitness for purpose or data from prior rounds. The Pa score is only one of several possible performance scores discussed in the ISO 13528 standard.
<SUBSET/EXCEPT/FOR qualification> where <x> is the response variable; <xref> is a parameter that defines the assigned value; <deltae> is a parameter that defines the DELTAe value; <y> is a variable where the Pa score values are stored; and where the <SUBSET/EXCEPT/FOR qualification> is optional.
PA is a synonym for ISO 13528 PA SCORE
. Step 1: Read the Data
.
skip 25
read e2489a.dat labid y
.
. Step 2: Compute and print the Pa values
.
let xref = median y
let sd = sd y
let deltae = 3*sd
let deltae = round(deltae,2)
.
let pa = iso 13528 pa y xref deltae
.
set write decimals 3
print y pa
.
. Step 3: Plot the Pa values
.
tic mark offset units screen
tic mark offset 3 3
case asis
label case ais
title case asis
title offset 2
.
y1label Percentage of Allowed Deviation (Pa)
x1label Laboratory
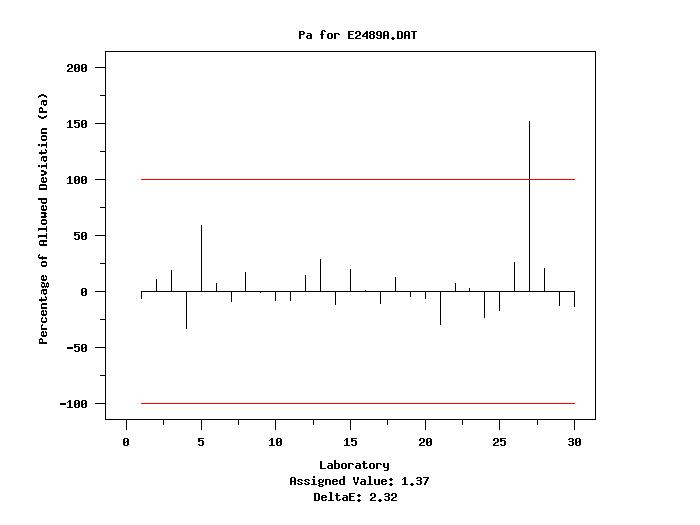
x2label Assigned Value: ^xref
x3label DeltaE: ^deltae
title Pa for E2489A.DAT
line blank solid dash dash
spike on
line color black black red red
.
let xmax = maximum labid
let xtemp = data 1 xmax
let ymax = data 100 100
let ymin = data -100 -100
let yzero = data 0 0
plot pa labid and
plot yzero xtemp and
plot ymax xtemp and
plot ymin xtemp
The following output is generated
------------------------------
              Y             PA
------------------------------
          1.220         -6.466
          1.620         10.776
          1.820         19.397
          0.600        -33.190
          2.750         59.483
          1.550          7.759
          1.170         -8.621
          1.760         16.810
          1.350         -0.862
          1.180         -8.190
          1.190         -7.759
          1.710         14.655
          2.030         28.448
          1.100        -11.638
          1.840         20.259
          1.390          0.862
          1.130        -10.345
          1.660         12.500
          1.280         -3.879
          1.240         -5.603
          0.690        -29.310
          1.540          7.328
          1.430          2.586
          0.840        -22.845
          0.980        -16.810
          1.970         25.862
          4.890        151.724
          1.850         20.690
          1.090        -12.069
          1.070        -12.931
|
Privacy
Policy/Security Notice
NIST is an agency of the U.S.
Commerce Department.
Date created: 04/11/2016 | ||||||||||||||||||||||||||||||