|
|
NORPPCCVName:
For a normal distribution, critical values for this statistic have been determined by simulation. The original tables were computed by Filliben and more extensive versions of the tables were computed by Devaney. The current tables are available for N = 3 to 1,000 and for signficance levels of 0.01 or 0.05 (the PPCC provides a lower tailed test). Significance levels of 0.99 and 0.95 are interpreted as 0.01 and 0.05, respectively. PPCC values less than the critical value reject the hypothesis of a normal distribution.
where <n> is a variable, parameter or number indicating the sample size; and <k> is a variable, parameter or number indicating the significance level; <y> is a variable or a parameter (depending on what <n> and <k> are) where the computed critical value is stored.
LET A = NORPPCV(N,0.01) LET A = NORPPCV(N,0.05) LET A = NORPPCV(105,0.05)
Judy Devaney, Phd Thesis, George Mason University.
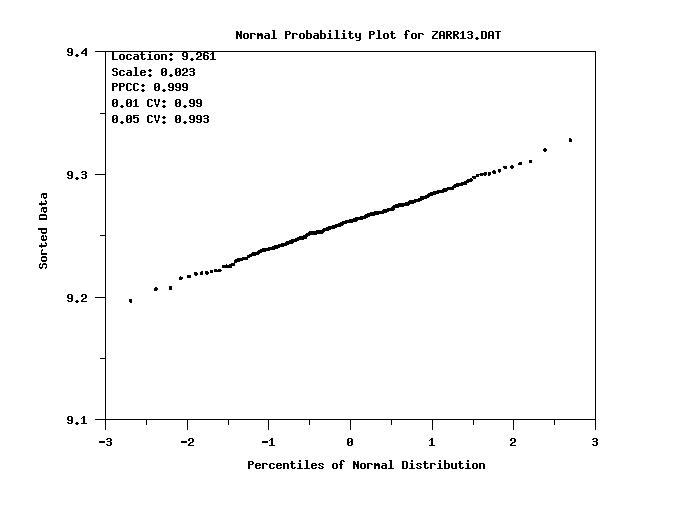
. Step 1:   Read the data
.
skip 25
read zarr13.dat y
.
. Step 2:   Generate normal probability plot with PPCC
.           value and associated critical values
.
let n = size y
let alpha = 0.01
let cv1 = norppcv(n,alpha)
let cv1 = round(cv1,3)
let alpha = 0.05
let cv2 = norppcv(n,alpha)
let cv2 = round(cv2,3)
.
char circle
char fill on
char hw 0.5 0.375
line blank
y1label Sorted Data
x1label Percentiles of Normal Distribution
title Normal Probability Plot for ZARR13.DAT
title case asis
title offset 2
label case asis
ylimits 9.1  9.4
major y1tic mark number 4
.
normal probability plot y
.
let ppcc = round(ppcc,3)
let ppa0 = round(ppa0,3)
let ppa1 = round(ppa1,3)
case asis
justification left
move 16 88
text Location: ^ppa0
move 16 85
text Scale: ^ppa1
move 16 82
text PPCC: ^ppcc
move 16 79
text 0.01 CV: ^cv1
move 16 76
text 0.05 CV: ^cv2
|
Privacy
Policy/Security Notice
NIST is an agency of the U.S.
Commerce Department.
Date created: 01/31/2015 | ||||||||||