
|
|
STATISTIC PPCCName:
Although this value is normally determined using either a probability plot or a ppcc plot, for a limited number of distributions you can also generate this as a statistic LET subcommand. The advantage in this case is that you can use it with any of the commands that support built-in statistics (e.g., the STATISTIC PLOT or the TABULATION command). This command was updated 2013/02 in the following ways.
where <y> is a response variable; <dist> is one of the distributions listed in the Note section below; <par> is the parameter where the ppcc value is saved; and where the <SUBSET/EXCEPT/FOR qualification> is optional.
where <y> is a response variable; <dist> is one of the distributions described in the Note section below; <par> is the parameter where the location value is saved; and where the <SUBSET/EXCEPT/FOR qualification> is optional. This syntax returns the estimate of the location parameter rather than the PPCC value.
where <y> is a response variable; <dist> is one of the distributions described in the Note section below; <par> is the parameter where the scale value is saved; and where the <SUBSET/EXCEPT/FOR qualification> is optional. This syntax returns the estimate of the location parameter rather than the PPCC value.
where <y> is a response variable; <dist> is one of the distributions with shape parameters described in the Note section below; <par> is the parameter where the ppcc value is saved; and where the <SUBSET/EXCEPT/FOR qualification> is optional. When the distribution has a shape parameter, then the word STATISTIC is required to distinguish this command from the PPCC PLOT command. Specifically the following can conflict
WEIBULL PPCC PLOT Y The first command is the Weibull PPCC plot while the second command plots the PPCC value for Y for each group in X.
where <y> is a response variable; <dist> is one of the distributions with a single shape parameter described in the Note section below; <par> is the parameter where the shape value is saved; and where the <SUBSET/EXCEPT/FOR qualification> is optional. This syntax returns the estimate of the shape parameter rather than the PPCC value.
where <y> is a response variable; <dist> is one of the distributions with two shape parameters described in the Note section below; <par> is the parameter where the shape value is saved; and where the <SUBSET/EXCEPT/FOR qualification> is optional. This syntax returns the estimate of the first shape parameter rather than the PPCC value.
where <y> is a response variable; <dist> is one of the distributions with two shape parameters described in the Note section below; <par> is the parameter where the shape value is saved; and where the <SUBSET/EXCEPT/FOR qualification> is optional. This syntax returns the estimate of the second shape parameter rather than the PPCC value.
LET A = DOUBLE EXPONENTIAL PPCC Y SUBSET Y > -3
LET A = ARCSINE PPCC Y LET A = CAUCHY PPCC Y LET A = COSINE PPCC Y LET A = DOUBLE EXPONENTIAL PPCC Y LET A = EXPONENTIAL PPCC Y LET A = HALF CAUCHY PPCC Y LET A = HALF NORMAL PPCC Y LET A = HYPERBOLIC SECANT PPCC Y LET A = LOGISTIC PPCC Y LET A = MAXWELL PPCC Y LET A = MAXIMUM GUMBEL PPCC Y LET A = MINIMUM GUMBEL PPCC Y LET A = MAXWELL PPCC Y LET A = NORMAL PPCC Y LET A = RAYLEIGH PPCC Y LET A = SEMICIRCULAR PPCC Y LET A = SLASH PPCC Y LET A = UNIFORM PPCC Y In addition, the following distributions with a single shape parameter are supported. If you want a fixed value of the shape parameter, you can specify it as shown here.
LET A = WEIBULL PPCC STATISTIC Y LET A = 2PARAMETER WEIBULL PPCC STATISTIC Y
LET GAMMA = <value>
LET GAMMA = <value>
LET GAMMA = <value>
LET GAMMA = <value>
LET GAMMA = <value>
LET SIGMA = <value>
LET LAMBDA = <value>
LET G = <value> In addition, the following distribution with two shape parameters is supported. If you want a fixed value of the shape parameters, you can specify it as shown here.
LET H = <value> LET A = G AND H PPCC STATISTIC Y
2013/02: Support for location, scale, and shape parameters 2013/02: Additional distributions 2015/02: g distribution 2016/06: Support for 2-parameter Weibull
SKIP 25
READ GEAR.DAT Y X
.
LABEL CASE ASIS
Y1LABEL Correlation
X1LABEL Batch
Y1LABEL DISPLACEMENT 15
X1LABEL DISPLACEMENT 12
TITLE CASE ASIS
TITLE OFFSET 2
XLIMITS 1 10
X1TIC MARK OFFSET 0.5 0.5
YLIMITS 0.92 0.99
TIC MARK OFFSET UNITS DATA
LINE BLANK SOLID
CHARACTER X BLANK
.
MULTIPLOT CORNER COORDIANTES 2 2 98 98
MULTIPLOT SCALE FACTOR 2
MULTIPLOT 2 2
.
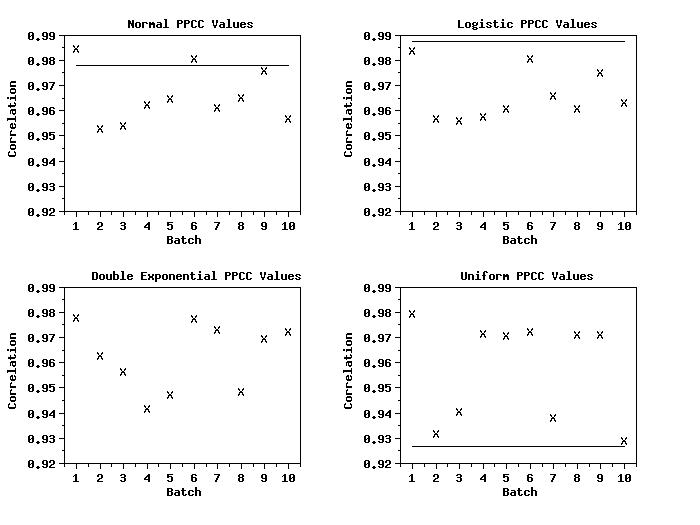
TITLE Normal PPCC Values
NORMAL PPCC PLOT Y X
TITLE Logistic PPCC Values
LOGISTIC PPCC PLOT Y X
TITLE Double Exponential PPCC Values
DOUBLE EXPONENTIAL PPCC PLOT Y X
TITLE Uniform PPCC Values
UNIFORM PPCC PLOT Y X
.
END OF MULTIPLOT
 Program 2:
skip 25
read gear.dat y x
.
tic mark offset units screen
tic mark offset 5 5
char X
line blank
.
multiplot scale factor 2
multiplot corner coordinates 5 5 95 95
.
y1label displacement 16
x1label displacement 12
title offset 2
label case asis
title automatic
x1label Batch
.
multiplot 2 2
y1label Correlation
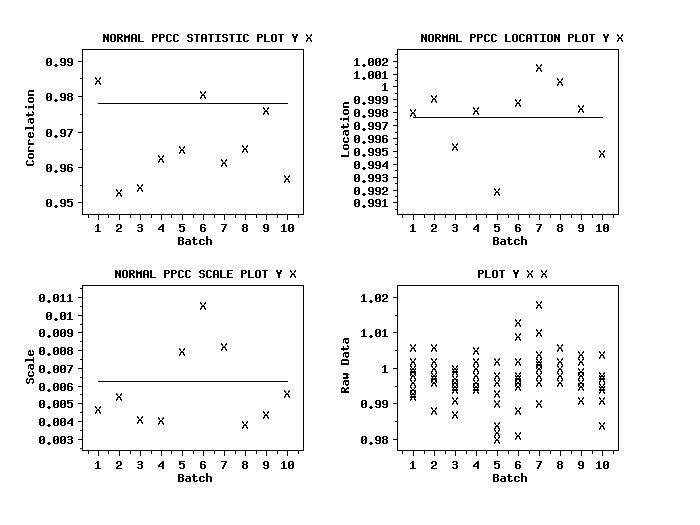
normal ppcc statistic plot y x
y1label Location
normal ppcc location plot y x
y1label Scale
normal ppcc scale plot y x
char X all
line blank all
y1label Raw Data
plot y x x
end of multiplot
|
Privacy
Policy/Security Notice
NIST is an agency of the U.S.
Commerce Department.
Date created: 06/23/2011 | ||||||||||||