|
|
KAPPDFName:
with k and h denoting the shape parameters and \( \xi \) and \( \alpha \) denoting the location and scale parameters, respectively, and where F is the kappa cumulative distribution function. The upper bound of x is
The lower bound of x is
The standard form of the distribution is defined as \( \xi \) = 0 and \( \alpha \) = 1. The cases h = -1, h = 0, and h = 1 reduce to the Hosking generalized logistic distribution, the generalized extreme value distribution, and the generalized Pareto distribution, respectively. According to Hosking and Wallis, the most useful values of the shape parameters are when h >= -1.
<SUBSET/EXCEPT/FOR qualification> where <x> is a number, parameter, or variable; <k> is a number, parameter, or variable that specifies the first shape parameter; <h> is a number, parameter, or variable that specifies the second shape parameter; <xi> is a number, parameter, or variable that specifies the location parameter; <alpha> is a number, parameter, or variable that specifies the scale parameter; <y> is a variable or a parameter (depending on what <x> is) where the computed kappa pdf value is stored; and where the <SUBSET/EXCEPT/FOR qualification> is optional. The <xi> and <alpha> parameters are optional.
LET X2 = KAPPDF(X1,K,H)
LET H = <value>> LET Y = KAPPA RANDOM NUMBERS FOR I = 1 1 N> KAPPA PROBABILITY PLOT Y> KAPPA PROBABILITY PLOT Y2 X2> KAPPA PROBABILITY PLOT Y3 XLOW XHIGH> KAPPA KOLMOGOROV SMIRNOV GOODNESS OF FIT Y> KAPPA CHI-SQUARE GOODNESS OF FIT Y2 X2> KAPPA CHI-SQUARE GOODNESS OF FIT Y3 XLOW XHIGH> The following commands can be used to estimate the k and h shape parameter for the kappa distribution:
LET K2 = <value> LET H1 = <value> LET H2 = <value> KAPPA PPCC PLOT Y KAPPA PPCC PLOT Y2 X2 KAPPA PPCC PLOT Y3 XLOW XHIGH KAPPA KS PLOT Y KAPPA KS PLOT Y2 X2 KAPPA KS PLOT Y3 XLOW XHIGH The default values for K1 and K2 are -5 and 5, respectively. The default values for THETA1 and THETA2 are -2 and 5, respectively. The probability plot can then be used to estimate the location and scale (location = PPA0, scale = PPA1). The BOOTSTRAP DISTRIBUTION command can be used to find uncertainty intervals for the ppcc plot and the ks plot. The parameters of the kappa distribution can be estimated by the method of L-moments using the command
Dataplot uses Hoskings code for computing the L-moments parameter estimates. Hoskings report and associated Fortran code can be downloaded from the Statlib archive at
J. R. M. Hosking (2000), "Research Report: Fortran Routines for use with the Method of L-Moments", IBM Research Division, T. J. Watson Research Center, Yorktown Heights, NY 10598. Hoskings (1990), "L-moments: Analysis and Estimation of Distribution using Linear Combinations of Order Statistics", Journal of the Royal Statistical Society, Series B, 52, pp. 105-124.
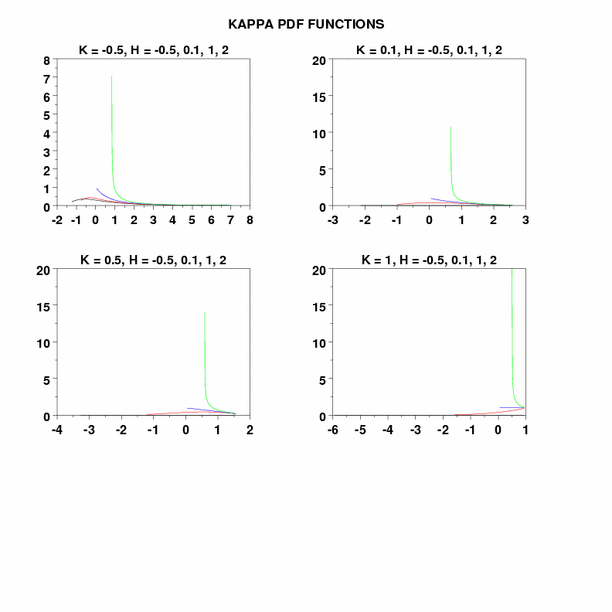
LET KP = DATA -0.5 0.1 0.5 1.0
LET H1 = -0.5
LET H2 = 0.1
LET H3 = 1
LET H4 = 2
.
MULTIPLOT 2 2
MULTIPLOT CORNER COORDINATES 0 0 95 95
MULTIPLOT SCALE FACTOR 2
TITLE CASE ASIS
TITLE OFFSET 2
X3LABEL
LINE COLOR BLACK RED BLUE GREEN
.
LOOP FOR KK = 1 1 4
LET K = KP(KK)
LET LL1 = KAPPPF(0.05,K,H1)
LET UL1 = KAPPPF(0.95,K,H1)
LET LL2 = KAPPPF(0.05,K,H2)
LET UL2 = KAPPPF(0.95,K,H2)
LET LL3 = KAPPPF(0.05,K,H3)
LET UL3 = KAPPPF(0.95,K,H3)
LET LL4 = KAPPPF(0.05,K,H4)
LET UL4 = KAPPPF(0.95,K,H4)
TITLE K = ^K, H = -0.5, 0.1, 1, 2
PLOT KAPPDF(X,K,H1) FOR X = LL1 0.01 UL1 AND
PLOT KAPPDF(X,K,H2) FOR X = LL2 0.01 UL2 AND
PLOT KAPPDF(X,K,H3) FOR X = LL3 0.01 UL3 AND
PLOT KAPPDF(X,K,H4) FOR X = LL4 0.01 UL4
END OF LOOP
END OF MULTIPLOT
.
JUSTIFICATION CENTER
MOVE 50 97
TEXT Kappa PDF Functions
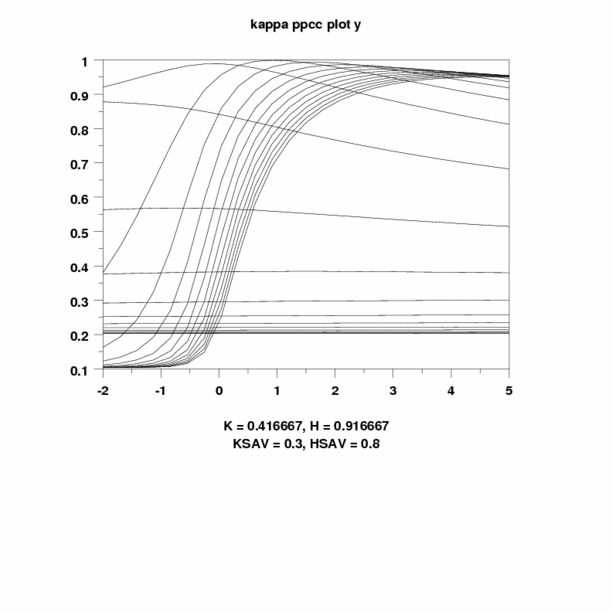
let k = 0.3
let h = 0.8
let ksav = k
let hsav = h
.
let xlow = kapppf(0.001,k,h)
let xhigh = kapppf(0.999,k,h)
.
x3label
.
let y = kappa rand numb for i = 1 1 200
let y = 5*y
.
x3label
title automatic
title case asis
.
kappa ppcc plot y
let k = shape1
let h = shape2
just center
move 50 6
text k = ^k, h = ^h
move 50 2
text ksav = ^ksav, hsav = ^hsav
pause
.
char x
line blank
kappa prob plot y
move 50 6
text ppa0 = ^ppa0, ppa1 = ^ppa1
move 50 2
text ppcc = ^ppcc
char blank
line solid
pause
.
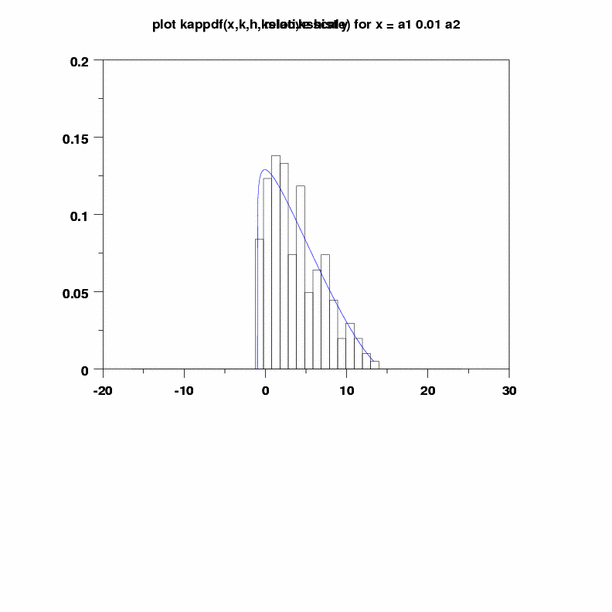
relative hist y
limits freeze
pre-erase off
title
let a1 = minimum y
let a2 = maximum y
line color blue red
let ll = kapppf(0.01,k,h,ppa0,ppa1)
let ul = kapppf(0.99,k,h,ppa0,ppa1)
plot kappdf(x,k,h,ppa0,ppa1) for x = ll 0.01 ul
line color black
limits
pre-erase on
title automatic
pause
.
let ksloc = ppa0
let ksscale = ppa1
kappa kolm smir goodness of fit y
pause
.
kappa mle y
.
let k = kml
let h = hml
let ksloc = ximl
let ksscale = alphaml
relative hist y
limits freeze
pre-erase off
let a1 = minimum y
let a2 = maximum y
line color blue red
plot kappdf(x,k,h,ksloc,ksscale) for x = a1 0.01 a2
line color black
limits
pre-erase on
.
kappa kolm smir goodness of fit y
Outputs for PPCC fitting.
                  KOLMOGOROV-SMIRNOV GOODNESS-OF-FIT TEST

NULL HYPOTHESIS H0:      DISTRIBUTION FITS THE DATA
ALTERNATE HYPOTHESIS HA: DISTRIBUTION DOES NOT FIT THE DATA
DISTRIBUTION:            KAPPA
   NUMBER OF OBSERVATIONS              =      200

TEST:
KOLMOGOROV-SMIRNOV TEST STATISTIC      =   0.3728781E-01

   ALPHA LEVEL         CUTOFF              CONCLUSION
           10%       0.086*              ACCEPT H0
                     0.085**
            5%       0.096*              ACCEPT H0
                     0.095**
            1%       0.115*              ACCEPT H0
                     0.114**

    *  - STANDARD LARGE SAMPLE APPROXIMATION  ( C/SQRT(N) )
   ** - MORE ACCURATE LARGE SAMPLE APPROXIMATION  ( C/SQRT(N + SQRT(N/10)) )
Outputs for L-moments fitting.
            KAPPA PARAMETER ESTIMATION:

SUMMARY STATISTICS:
NUMBER OF OBSERVATIONS                     =      200
SAMPLE MEAN                                =    3.826996
SAMPLE STANDARD DEVIATION                  =    3.380150
SAMPLE MINIMUM                             =   -1.124539
SAMPLE MAXIMUM                             =    13.35444

L-MOMENTS:
FIRST SAMPLE L-MOMENT                      =    3.826996
SECOND SAMPLE L-MOMENT                     =    1.901070
THIRD SAMPLE L-MOMENT                      =   0.1587699
FOURTH SAMPLE L-MOMENT                      =   0.7563092E-01

ESTIMATE OF LOCATION                       =   0.2250852
ESTIMATE OF SCALE                          =    5.308738
ESTIMATE OF K                              =   0.3297350
ESTIMATE OF H                              =   0.7777997
                  KOLMOGOROV-SMIRNOV GOODNESS-OF-FIT TEST

NULL HYPOTHESIS H0:      DISTRIBUTION FITS THE DATA
ALTERNATE HYPOTHESIS HA: DISTRIBUTION DOES NOT FIT THE DATA
DISTRIBUTION:            KAPPA
   NUMBER OF OBSERVATIONS              =      200

TEST:
KOLMOGOROV-SMIRNOV TEST STATISTIC      =   0.3728781E-01

   ALPHA LEVEL         CUTOFF              CONCLUSION
           10%       0.086*              ACCEPT H0
                     0.085**
            5%       0.096*              ACCEPT H0
                     0.095**
            1%       0.115*              ACCEPT H0
                     0.114**

    *  - STANDARD LARGE SAMPLE APPROXIMATION  ( C/SQRT(N) )
   ** - MORE ACCURATE LARGE SAMPLE APPROXIMATION  ( C/SQRT(N + SQRT(N/10)) )
|
Privacy
Policy/Security Notice
NIST is an agency of the U.S.
Commerce Department.
Date created: 07/15/2009 | ||||||||||||||||