
|
|
CROSS TABULATE (LET)Name:
The distinction is that those commands compute one value of the staistic for unique cell in the cross tabulation. This command creates a new array of the same size as the input arrays and replaces ALL rows in the new array with the computed statistic corresponding to the cell in the cross tabulation. The reason for this command is to allow the cross tabulated values to be used in subsequent calculations. For example, you could use this command to subtract the cell mean and divide by the cell standard deviation. Although you can perform this particular computation using the STANDARDIZE command, it does illustrate how this command is intended to be used. In particular, it can helpful in computing statistics for one or two group variables that are not currently supported by the STATISTIC PLOT or CROSS TABULATE PLOT commands. An alternative to computing a single value of the statistic for each cell in the cross tabulaton is compute the cumulative value of the statistic for all elements in the cell.
<SUBSET/EXCEPT/FOR qualification> where <stat> is one of the supported statistics (HELP STATISTICS for a list; <y1> ... <yk> is a list of 1 to 3 response variables (depending on what <stat> is); <x1> ... <xl> is a list of 0 to 4 group-id variables; <yout> is a variable where the cross tabulated values are stored; and where the <SUBSET/EXCEPT/FOR qualification> is optional.
<x1> ... <xl> <SUBSET/EXCEPT/FOR qualification> where <stat> is one of the supported statistics (HELP STATISTICS for a list; <y1> ... <yk> is a list of 1 to 3 response variables (depending on what <stat> is); <x1> ... <xl> is a list of 0 to 4 group-id variables; <yout> is a variable where the cross tabulated values are stored; and where the <SUBSET/EXCEPT/FOR qualification> is optional. This syntax computes the cumulative value of the statistic.
LET Y2 = CROSS TABULATE MEAN Y X1 LET Y2 = CROSS TABULATE MEAN Y X1 X2 LET Y2 = CROSS TABULATE CUMULATIVE MEAN Y X1 LET Y2 = CROSS TABULATE MEAN Y X1 X2 SUBSET X1 = 1 TO 3
only a single value will be saved in the output variable for each distinct combination of the group-id variables. In order to preserve the appropriate values of the group-id variables, you can enter the commands (assuming four group-id variables)
LET X2D = CROSS TABULATE GROUP TWO X1 X2 X3 X4 LET X3D = CROSS TABULATE GROUP THREE X1 X2 X3 X4 LET X4D = CROSS TABULATE GROUP FOUR X1 X2 X3 X4 This is demonstrated in Program 2 example below. To restore the default, enter
This option is not supported for the CUMULATIVE (Syntax 2) option.
For example, if X1 has the uniques values 1, 2, and 3 and X2 has the unique values 1 and 2, there are 6 potential cells
However, the X1 and X2 variables may not actually contain all of these potential combinations (i.e., you only have a partial grid of values). There may be some cases where you want the output variable to contain a value for the full grid of the group-id variables. To specify this, enter the command
In this case, empty cells in the grid will be set the "missing value". To specify this value, enter the command
To restore the default behavior, enter
This option is not supported for the CUMULATIVE (Syntax 2) option.
where
This option is not supported for the CUMULATIVE (Syntax 2) option.
2002/8: List of supported statistics expanded 2003/3: Support added for "WEIGHTED" and "DIFFERENCE OF" statistics. 2009/2: Support COLLAPSE option 2011/7: Support for SET LET CROSS TABULATE EMPTY 2011/7: Support for SET LET CROSS TABULATE COMPLEMENT 2013/1: Support for CUMULATIVE option
SKIP 25
READ GEAR.DAT Y X
LET YMED = CROSS TABULATE MEAN Y X
LET YIQ = CROSS TABULATE IQ RANGE Y X
LET YSTAND = (Y - YMED)/YIQ
SET WRITE DECIMALS 5
PRINT X Y YSTAND
The following output is generated
---------------------------------------------
              X              Y         YSTAND
---------------------------------------------
        1.00000        1.00600        1.18518
        1.00000        0.99600       -0.29629
        1.00000        0.99800        0.00000
        1.00000        1.00000        0.29629
        1.00000        0.99200       -0.88888
        1.00000        0.99300       -0.74074
        1.00000        1.00200        0.59259
        1.00000        0.99900        0.14814
        1.00000        0.99400       -0.59259
        1.00000        1.00000        0.29629
        2.00000        0.99800       -0.17599
        2.00000        1.00600        1.10399
        2.00000        1.00000        0.14399
        2.00000        1.00200        0.46399
        2.00000        0.99700       -0.33599
        2.00000        0.99800       -0.17599
        2.00000        0.99600       -0.49599
        2.00000        1.00000        0.14399
        2.00000        1.00600        1.10399
        2.00000        0.98800       -1.77599
        3.00000        0.99100       -0.76521
        3.00000        0.98700       -1.46086
        3.00000        0.99700        0.27826
        3.00000        0.99900        0.62608
        3.00000        0.99500       -0.06956
        3.00000        0.99400       -0.24347
        3.00000        1.00000        0.80000
        3.00000        0.99900        0.62608
        3.00000        0.99600        0.10434
        3.00000        0.99600        0.10434
        4.00000        1.00499        0.93793
        4.00000        1.00200        0.52413
        4.00000        0.99400       -0.57931
        4.00000        1.00000        0.24827
        4.00000        0.99500       -0.44137
        4.00000        0.99400       -0.57931
        4.00000        0.99800       -0.02758
        4.00000        0.99600       -0.30344
        4.00000        1.00200        0.52413
        4.00000        0.99600       -0.30344
        5.00000        0.99800        0.42068
        5.00000        0.99800        0.42068
        5.00000        0.98200       -0.68275
        5.00000        0.99000       -0.13103
        5.00000        1.00200        0.69655
        5.00000        0.98400       -0.54482
        5.00000        0.99600        0.28275
        5.00000        0.99300        0.07586
        5.00000        0.98000       -0.82068
        5.00000        0.99600        0.28275
        6.00000        1.00899        0.64761
        6.00000        1.01299        0.90158
        6.00000        1.00899        0.64761
        6.00000        0.99700       -0.11428
        6.00000        0.98800       -0.68571
        6.00000        1.00200        0.20317
        6.00000        0.99500       -0.24126
        6.00000        0.99800       -0.05079
        6.00000        0.98100       -1.13015
        6.00000        0.99600       -0.17777
        7.00000        0.99000       -1.21052
        7.00000        1.00400        0.26315
        7.00000        0.99600       -0.57894
        7.00000        1.00099       -0.05263
        7.00000        0.99800       -0.36842
        7.00000        1.00000       -0.15789
        7.00000        1.01800        1.73684
        7.00000        1.01000        0.89473
        7.00000        0.99600       -0.57894
        7.00000        1.00200        0.05263
        8.00000        0.99800       -0.43636
        8.00000        1.00000       -0.07272
        8.00000        1.00600        1.01818
        8.00000        1.00000       -0.07272
        8.00000        1.00200        0.29090
        8.00000        0.99600       -0.79999
        8.00000        0.99800       -0.43636
        8.00000        0.99600       -0.79999
        8.00000        1.00200        0.29090
        8.00000        1.00600        1.01818
        9.00000        1.00200        0.54814
        9.00000        0.99800       -0.04444
        9.00000        0.99600       -0.34074
        9.00000        0.99500       -0.48888
        9.00000        0.99600       -0.34074
        9.00000        1.00400        0.84444
        9.00000        1.00400        0.84444
        9.00000        0.99800       -0.04444
        9.00000        0.99900        0.10370
        9.00000        0.99100       -1.08148
       10.00000        0.99100       -0.60799
       10.00000        0.99500        0.03200
       10.00000        0.98400       -1.72799
       10.00000        0.99400       -0.12799
       10.00000        0.99700        0.35200
       10.00000        0.99700        0.35200
       10.00000        0.99100       -0.60799
       10.00000        0.99800        0.51200
       10.00000        1.00400        1.47200
       10.00000        0.99700        0.35200
Program 2:
SKIP 25
READ GEAR.DAT Y X
SET LET CROSS TABULATE COLLAPSE
LET YMEAN = CROSS TABULATE MEAN Y X
LET X1D = CROSS TABULATE GROUP ONE X
SET WRITE DECIMALS 4
PRINT X1D YMEAN
The following output is generated
------------------------------
            X1D          YMEAN
------------------------------
         1.0000         0.9980
         2.0000         0.9991
         3.0000         0.9954
         4.0000         0.9982
         5.0000         0.9919
         6.0000         0.9988
         7.0000         1.0015
         8.0000         1.0003
         9.0000         0.9982
        10.0000         0.9947
Program 3:
SKIP 25
READ GEAR.DAT Y X
LET N = SIZE Y
LET X2 = SEQUENCE 1 1 N
.
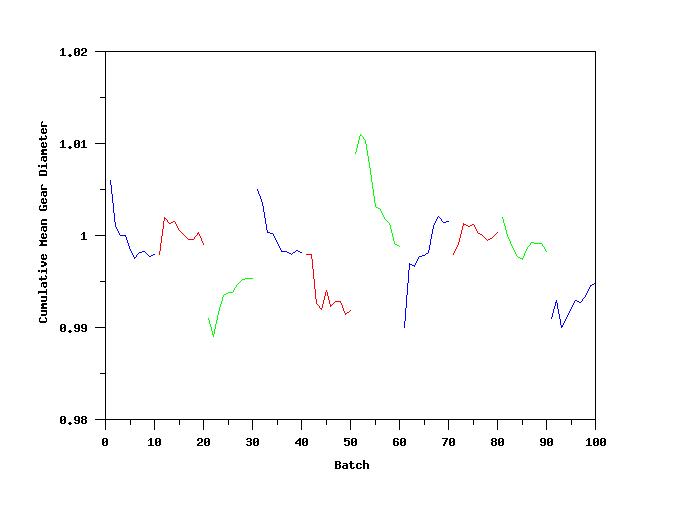
LET YMEAN = CROSS TABULATE CUMULATIVE MEAN Y X
.
SET WRITE DECIMALS 4
PRINT X Y YMEAN
.
LINE COLOR BLUE RED GREEN BLUE RED GREEN BLUE RED GREEN BLUE
LABEL CASE ASIS
Y1LABEL Cumulative Mean Gear Diameter
X1LABEL Batch
.
PLOT YMEAN X2 X
Date created: 10/5/2001 |