CPM
Name:
Type:
Purpose:
Compute the process capability index (CPM) for a variable.
Description:
The process capability index measure the performance (i.e., the
capability) of an industrial process. The CPM is a variant of
the CP and CPK capability indices.
\( CPM = \frac{\mbox{USL} - \mbox{LSL}}
{6 \sqrt{s^2 + (\bar{x} - \mbox{TARGET})^2}} \)
where USL and LSL are user specified upper and lower
specification limits, TARGET is the target engineering limit,
 and s are the sample mean and standard deviation of the
data. For this statistic, larger is better.
and s are the sample mean and standard deviation of the
data. For this statistic, larger is better.
The specification limits define the range within which a
product is considered acceptable (values outside this range
indicate that a product is defective).
Syntax:
LET <par> = CPM <y>
<SUBSET/EXCEPT/FOR qualification>
where <y> is the response variable;
<par> is a parameter where the computed CPM is
stored;
and where the <SUBSET/EXCEPT/FOR qualification> is optional.
Examples:
LET A = CPM Y1
LET A = CPM Y1 SUBSET TAG > 2
Note:
The upper and lower specification limits and target value
must be specified by the user as follows:
LET LSL = <value>
LET USL = <value>
LET TARGET = <value>
Note:
Dataplot statistics can be used in a number of commands. For
details, enter
Default:
Synonyms:
Related Commands:
|
CONTROL
CHART
|
= Generate a control chart.
|
|
STATISTIC
PLOT
|
= Generate a statistic versus subset plot.
|
|
DEX ... PLOT
|
= Generate a dex <statistic> plot.
|
|
CP
|
= Compute the process capability index.
|
|
CPK
|
= Compute the process capability index.
|
|
CNPK
|
= Compute the process capability index.
|
|
CC
|
= Compute the process capability index.
|
|
PERCENT DEFECTIVE
|
= Compute the percentage of defectives in a sample.
|
|
EXPECTED LOSS
|
= Compute the expected loss of a sample.
|
Reference:
Kaoru Ishikawa (1982), "Guide to Quality Control,"
Asian Productivity Organization, (chapter 13).
Applications:
Implementation Date:
Program:
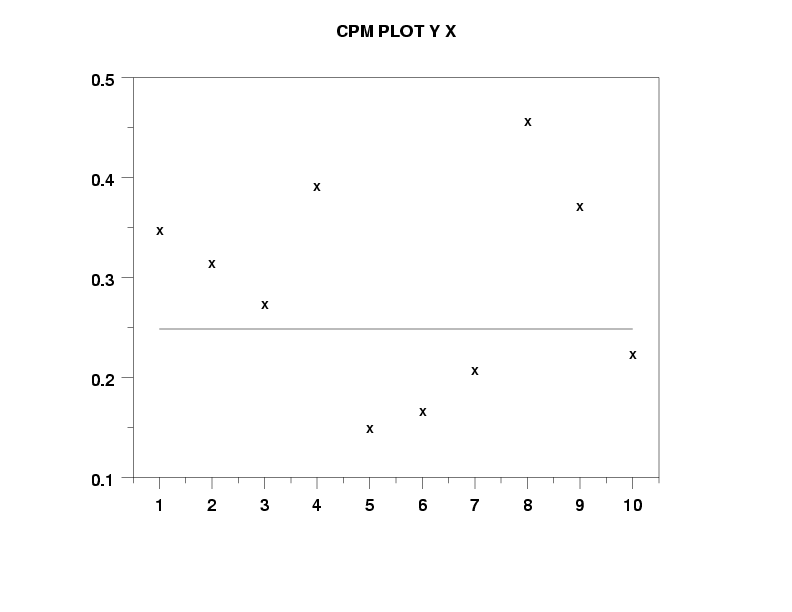
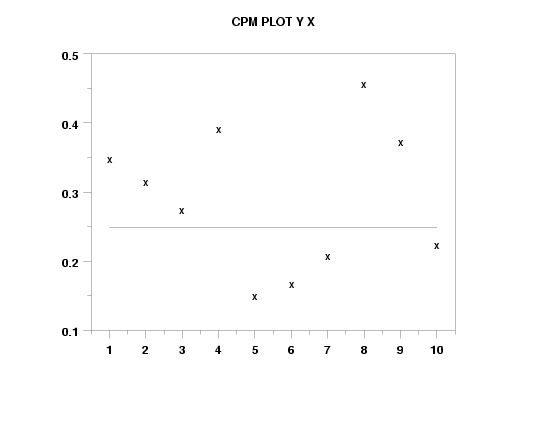
SKIP 25
READ GEAR.DAT Y X
LET LSL = 0.995
LET USL = 1.005
LET TARGET = 1.0
CHARACTER X BLANK
LINE BLANK SOLID
TITLE AUTOMATIC
CPM PLOT Y X
|
Privacy
Policy/Security Notice
Disclaimer |
FOIA
NIST is an agency of the U.S.
Commerce Department.
Date created: 06/05/2001
Last updated: 11/02/2015
Please email comments on this WWW page to
[email protected].
|
|