
|
|
WINDOW STATISTIC PLOTName:
The <stat> WINDOW STATISTIC PLOT is a variant of the <stat> STATISTIC PLOT. However, they differ in how the groups are determined. For the STATISTIC PLOT, response values are grouped by the unique values of the group-id variable. The group-id variable does not need to be sorted. With the WINDOW STATISTIC PLOT, groups are formed from a user specified number of contiguous rows of the response variable. That is, if the user specifies a group size of 100, then rows 1 to 100 form the first group, rows 101 to 200 form the second group, and so on. This plot is motivated by large data sets. When the number of points to be plotted is very large, it may become impractical to generate a run sequence plot of all the raw data. Either the details get lost or the Postscript file becomes unrealistically large. An alternative is to plot various summary statistics for subsets of the data. For example, you can plot the mean, standard deviaiton, minimum, and maximum values for each of the slices of the data. To specify the size of the slices, enter the command LET NSIZE = <value> If this command is not given, NSIZE will be set to N/100 for N > 1000 and to N/10 for N <= 1000. There are two cases.
<SUBSET/EXCEPT/FOR qualification> where <stat> is one of Dataplot's supported statistics; <y1> ... <yk> is a list of 1 to 3 response variables (<stat> determines how many response variables); and where the <SUBSET/EXCEPT/FOR qualification> is optional. For a list of supported statistics, enter
This is the commonly used syntax for this command.
<SUBSET/EXCEPT/FOR qualification> where <stat> is one of Dataplot's supported statistics; <y1> ... <yk> is a list of 1 to 3 response variables (<stat> determines how many response variables); <x> is a group-id variable; and where the <SUBSET/EXCEPT/FOR qualification> is optional. This syntax is used for the case where there is a group-id variable. This syntax is not typically used as the WINDOW PLOT implicitly forms groups in the data.
MEAN WINDOW STATISTIC PLOT Y SUBSET Y > 0 MINIMUM WINDOW STATISTIC PLOT Y SD WINDOW STATISTIC PLOT Y CORRELATION WINDOW STATISTIC PLOT Y1 Y2
The list of supported statistics is frequently updated. Enter HELP STATISTICS for a current list of supported statistics.
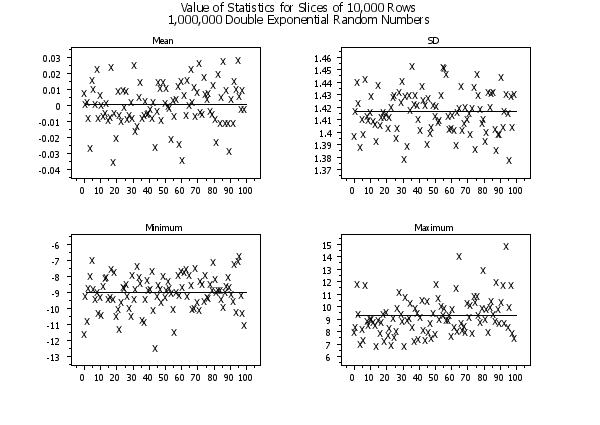
let y = double exponential random numbers for i = 1 1 1000000
.
line blank solid
character X blank
tic mark offset units screen
tic mark offset 5 5
title case asis
title offset 2
case asis
.
multiplot 2 2
multiplot scale factor 2
multiplot corner coordinates 5 5 95 95
let nsize = 10000
.
title Mean
mean window statistic plot y
title SD
sd window statistic plot y
title Minimum
minimum window statistic plot y
title Maximum
maximum window statistic plot y
.
end of multiplot
.
justification center
move 50 98
text Value of Statistics for Slices of 10,000 Rows
move 50 96
text 1,000,000 Double Exponential Random Numbers
Date created: 07/01/2016 |
Last updated: 12/04/2023 Please email comments on this WWW page to [email protected]. | ||||||||||||||||||||||||||||